Paramount Group (PGRE) shares have experienced modest movement this week, with recent trading activity reflecting quieter sentiment in the real estate sector. Investors are weighing the company’s recent performance and ongoing pressures in commercial property markets.
This week’s muted share price move for Paramount Group comes after a year of relatively steady trading. The stock is now at $6.53 and reflects cautious investor optimism. While the 1-year total shareholder return is just 0.34%, confidence in commercial real estate could drive momentum if market headwinds fade.
With Paramount Group’s recent underperformance and challenging financials, the big question remains: is the current share price a bargain waiting to be recognized, or is the market already accounting for any future turnaround?
Advertisement
Price-to-Sales Ratio of 2.1x: Is it justified?
Paramount Group trades at a price-to-sales (P/S) ratio of 2.1x, placing it slightly below both peer and industry averages, with a last close price of $6.53. This suggests the market sees it as better value compared to competitors in the office REITs sector.
The price-to-sales ratio measures the current share price relative to the company’s revenue per share. For real estate investment trusts, this metric provides a snapshot of how much investors are paying for each dollar of revenue generated. This approach is particularly useful for companies that may not be profitable.
Market participants are pricing Paramount Group more conservatively than its peers, potentially reflecting ongoing financial challenges and a lack of current profitability. Based on regression analysis, the estimated fair price-to-sales ratio is 2.4x. This indicates that there is room for the market valuation to rise toward this level if the outlook stabilizes or improves.
Compared to the US Office REITs industry average of 2.5x and peer average of 2.4x, Paramount Group’s present P/S multiple suggests relative undervaluation. The market may be underappreciating Paramount’s future revenue streams, especially as valuation metrics can shift rapidly with sector momentum.
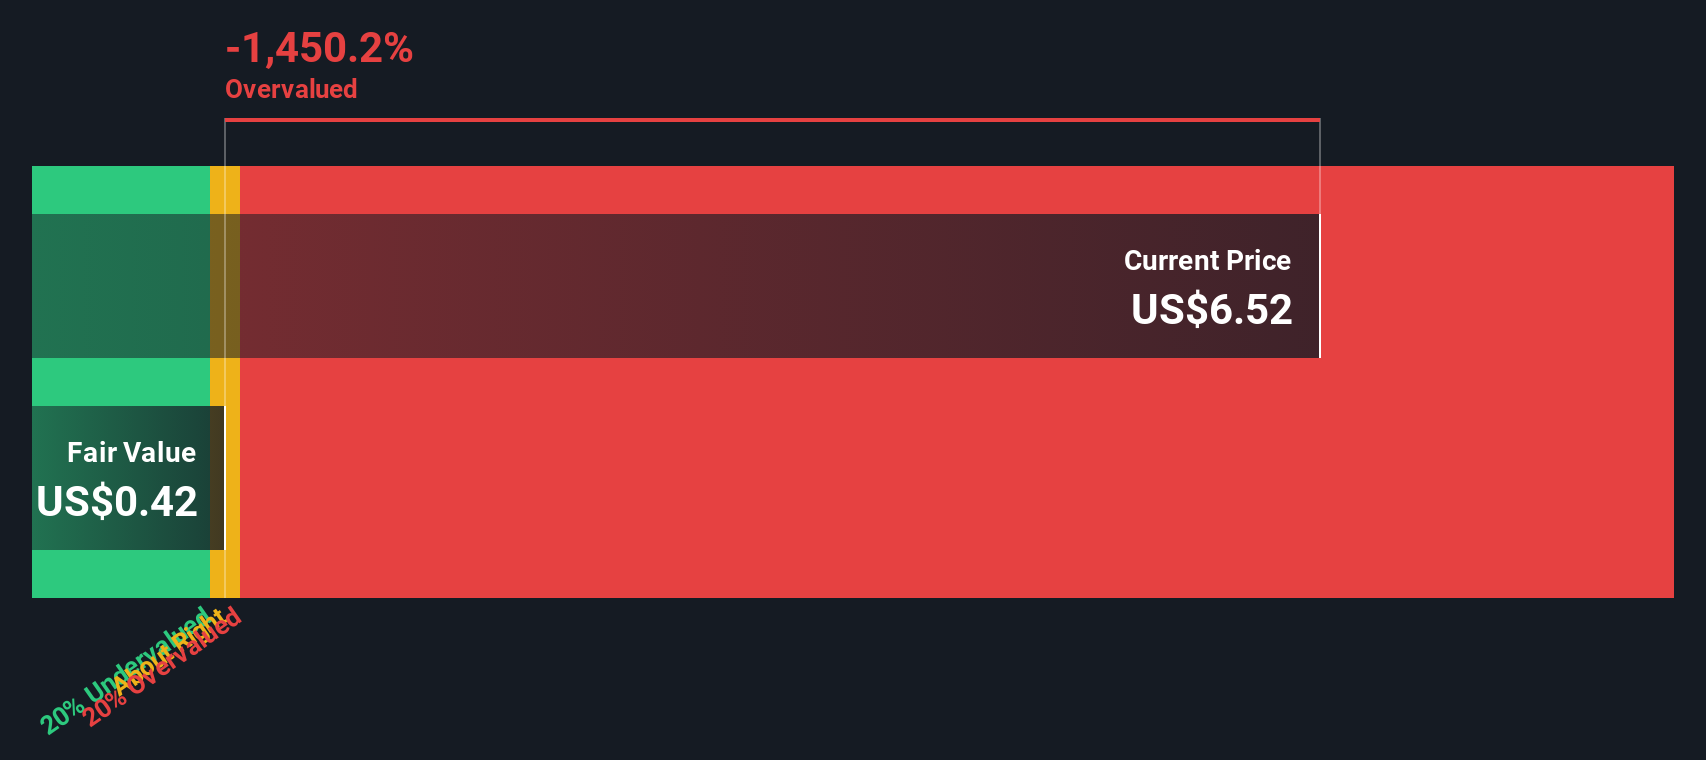
While the price-to-sales ratio presents Paramount Group as undervalued, the SWS DCF model reaches a sharply different conclusion. Our DCF estimate suggests fair value is just $0.42 per share, which is far below the current market price. Could the market be pricing in hope rather than fundamentals?
Simply Wall St performs a discounted cash flow (DCF) on every stock in the world every day (check out Paramount Group for example). We show the entire calculation in full. You can track the result in your watchlist or portfolio and be alerted when this changes, or use our stock screener to discover undervalued stocks based on their cash flows. If you save a screener we even alert you when new companies match - so you never miss a potential opportunity.
Build Your Own Paramount Group Narrative
If you have a different perspective or want to examine the numbers firsthand, you can quickly build your own take on the story in just a few minutes: Do it your way.
A great starting point for your Paramount Group research is our analysis highlighting 1 key reward and 2 important warning signs that could impact your investment decision.
Looking for more investment ideas?
Smart investors seize the moment. Uncover dynamic ways to grow your portfolio by tapping into unique stock themes shaping tomorrow’s markets with our handpicked screeners below.
Access breakthrough opportunities in cutting-edge healthcare innovation through these 31 healthcare AI stocks, which is transforming medical technology.
Position yourself at the forefront of tomorrow’s technology shift by tapping into these 26 quantum computing stocks, driving industry disruption.
This article by Simply Wall St is general in nature. We provide commentary based on historical data
and analyst forecasts only using an unbiased methodology and our articles are not intended to be financial advice. It does not constitute a recommendation to buy or sell any stock, and does not take account of your objectives, or your
financial situation. We aim to bring you long-term focused analysis driven by fundamental data.
Note that our analysis may not factor in the latest price-sensitive company announcements or qualitative material.
Simply Wall St has no position in any stocks mentioned.
New: Manage All Your Stock Portfolios in One Place
We've created the ultimate portfolio companion for stock investors, and it's free.
• Connect an unlimited number of Portfolios and see your total in one currency • Be alerted to new Warning Signs or Risks via email or mobile • Track the Fair Value of your stocks