Advertisement
- United States
- /
- Residential REITs
- /
- NYSE:AIV
Apartment Investment and Management (AIV): Assessing Valuation As Shares See Continued Weakness

Simply Wall St
Reviewed by Simply Wall St
Should Investors Rethink Apartment Investment and Management After Recent Moves?
Apartment Investment and Management (AIV) has seen its stock draw attention this month, leaving investors debating what might be behind the shift. While there is no headline-making event or single catalyst to blame, the latest stretch of trading may make observant shareholders wonder if there is a deeper signal worth examining. Sometimes a lack of news can be just as telling, especially when it coincides with changes in momentum.
Over the past year, AIV’s share price has moved lower, slipping 10% as the market weighs the future for real estate investment firms. Even in the short term, weakness has persisted, with the stock declining 5% over the past month and almost 12% in the past 3 months. Compared to where it started the year, that is a steady decline, and this momentum has made more investors consider whether the risk profile has changed or if something is being missed in the company’s fundamentals.
Is this drop opening a window for value-seeking buyers, or is the market anticipating challenges that are not yet in the headlines? Let’s take a closer look at the valuation puzzle from here.
Price-to-Sales Ratio of 5x: Is it justified?
Based on the most widely used valuation metric for real estate investment trusts, Apartment Investment and Management’s stock currently trades at a price-to-sales ratio of 5x. This is slightly below the broader North American Residential REITs industry average of 5.4x. This suggests that, at first glance, the stock could be seen as a reasonable value compared to industry peers.
The price-to-sales ratio compares a company’s market capitalization to its annual revenue. This provides investors with a snapshot of how much they are paying for each dollar of revenue generated. For REITs, where profits can fluctuate due to property sales, development activity, or one-time expenses, revenue multiples are often a more stable reference point than earnings-based ratios.
This valuation indicates that the market may be pricing Apartment Investment and Management slightly below the sector norm. This could reflect its recent trend of losses and ongoing unprofitability. Investors should consider whether the discount is warranted given the company’s operational and financial performance.
Result: Fair Value of $7.49 (ABOUT RIGHT)
See our latest analysis for Apartment Investment and Management.However, persistent net losses and a lack of clear revenue growth could quickly shift investor sentiment if operational challenges intensify or if market conditions worsen.
Find out about the key risks to this Apartment Investment and Management narrative.Another View: What Does Our DCF Model Indicate?
While sales ratios paint one picture for Apartment Investment and Management, our SWS DCF model takes a different approach by estimating future cash flows. This method has not pointed to a meaningful disconnect with the current price. Does this reinforce the idea that the market has priced in the company’s prospects, or could something be lurking beneath these headline numbers?
Look into how the SWS DCF model arrives at its fair value.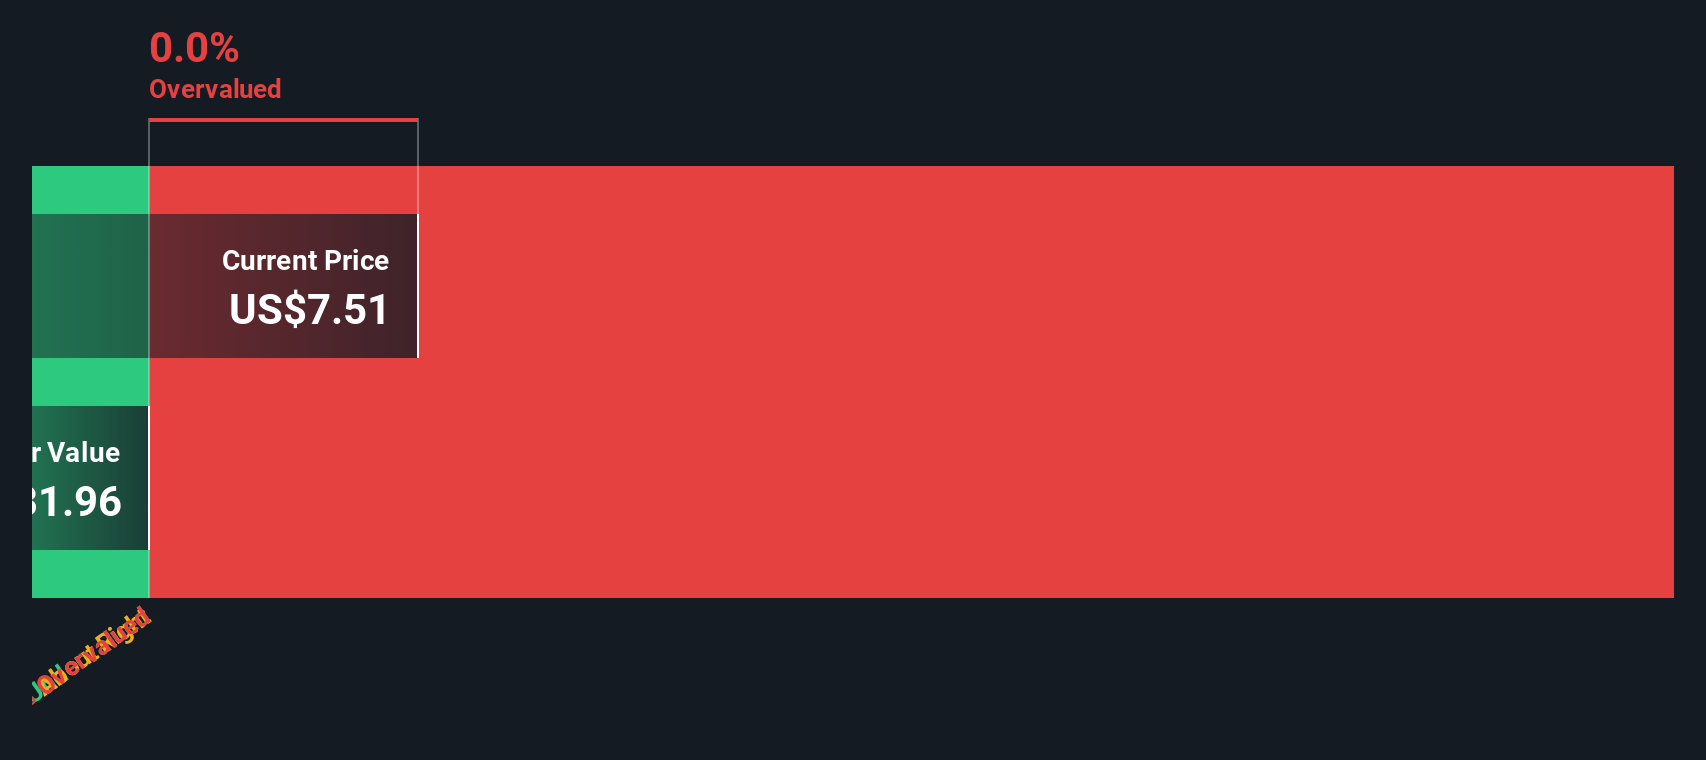
Build Your Own Apartment Investment and Management Narrative
If you see things differently or would rather draw your own conclusions, you can put together a personal assessment in just a few minutes. Do it your way.
A great starting point for your Apartment Investment and Management research is our analysis highlighting 3 important warning signs that could impact your investment decision.
Looking for More Investment Ideas?
Expand your investment game plan and avoid missing out on market opportunities. Use these hand-picked screens to track standout trends, fresh momentum, and future growth stories you might otherwise overlook.
- Fuel your income goals by sizing up companies offering dividend stocks with yields > 3% and see which ones deliver reliable yields above 3%.
- Seize the power of the next tech boom by pinpointing breakthrough quantum computing stocks for early exposure to cutting-edge quantum innovation.
- Spot bargain potential and protect your downside by filtering for stocks showing strong value with undervalued stocks based on cash flows based on cash flows.
This article by Simply Wall St is general in nature. We provide commentary based on historical data and analyst forecasts only using an unbiased methodology and our articles are not intended to be financial advice. It does not constitute a recommendation to buy or sell any stock, and does not take account of your objectives, or your financial situation. We aim to bring you long-term focused analysis driven by fundamental data. Note that our analysis may not factor in the latest price-sensitive company announcements or qualitative material. Simply Wall St has no position in any stocks mentioned.
New: Manage All Your Stock Portfolios in One Place
We've created the ultimate portfolio companion for stock investors, and it's free.
• Connect an unlimited number of Portfolios and see your total in one currency
• Be alerted to new Warning Signs or Risks via email or mobile
• Track the Fair Value of your stocks
Have feedback on this article? Concerned about the content? Get in touch with us directly. Alternatively, email editorial-team@simplywallst.com
About NYSE:AIV
Apartment Investment and Management
Aimco is a diversified real estate company primarily focused on value add and opportunistic investments, targeting the U.S.
Low risk unattractive dividend payer.
Market Insights

Advertisement
Community Narratives
100% Patient Improvement in trial puts this $16M Biotech on the radar
Fair Value US$5.30|69.8% undervalued
JO
Community Contributor
Exxon Mobil's 17.5% Upside Promises Industry-Leading Returns in Energy Transition
Fair Value US$132.00|15.0% undervalued
HE
Community Contributor
NHC Analysis: Quality at a Good Price. A Golden Opportunity?
Fair Value US$179.80|35.9% undervalued
DA
Community Contributor
Product Refresh And Global Expansion Will Empower Future Market Leadership
Fair Value US$206.17|19.6% undervalued
AN
Based on Analyst Price Targets