Advertisement
- United States
- /
- Specialized REITs
- /
- NasdaqGS:EQIX
Does Equinix Offer Opportunity After Recent Stock Slide in 2025?

Simply Wall St
Reviewed by Bailey Pemberton
If you are eyeing Equinix and wondering what your next move should be, you are not alone. It has been a bumpy ride for the global data center giant, with the stock closing at $772.60 recently. Short-term swings have tested investors' nerves, with the stock down 1.3% over the last week, barely changed over the past month, and still in the red for 2024 with a year-to-date drop of 18.2%. Even the past year is looking muted, with shares down 9.9%. Looking at the bigger picture, over the past three years, Equinix has delivered a strong 47.4% return, and it has remained positive over five years, up 2.9%.
The mood around Equinix and its sector has shifted recently. Ongoing changes in how large companies invest in cloud and networking infrastructure have created new opportunities, but also pockets of uncertainty about long-term demand and risk. These market dynamics are contributing to the push and pull in the price.
For investors thinking about value, here is the headline: based on common valuation metrics, Equinix scores a 3 out of 6 for being undervalued, which is solid but leaves some room for debate. So how do these six checks stack up, and do they highlight hidden opportunity or fresh risks? In the next sections, I will break down each approach and explain why the real story may emerge from using these methods together for a more complete perspective on what Equinix is truly worth.
Approach 1: Equinix Discounted Cash Flow (DCF) Analysis
The Discounted Cash Flow (DCF) model is designed to estimate what a company is really worth by projecting its future adjusted funds from operations and then discounting those values back to today. This helps investors judge if the current share price reflects the company’s fundamental earning power over time.
For Equinix, the latest twelve months of free cash flow totaled $3.36 billion. Analyst forecasts anticipate consistent growth, with free cash flow projected to climb to $5.32 billion by 2029. While analysts provide estimates for the next five years, further projections are extrapolated by Simply Wall St based on industry trends and historical data, aiming to capture a realistic path for Equinix’s future performance.
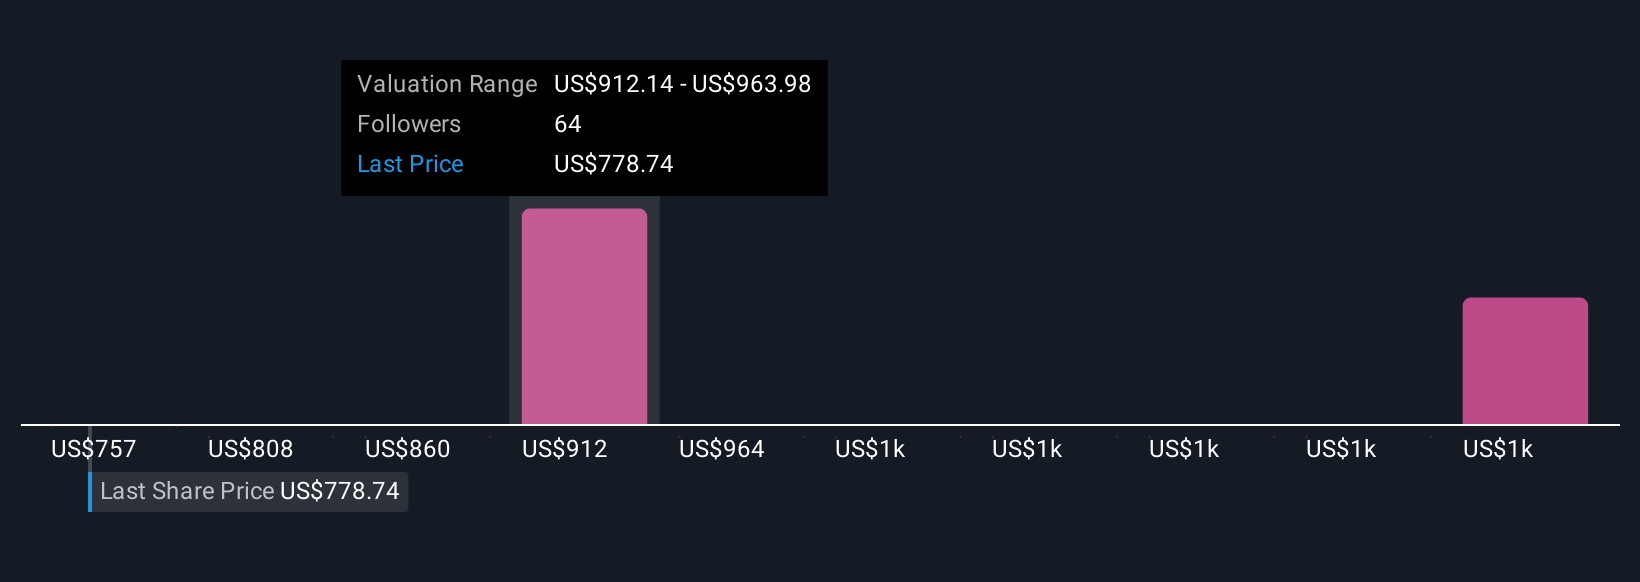
Crucially, the DCF approach suggests an intrinsic fair value of $1,275.74 per share. This is a significant discount compared to the current share price of $772.60, implying the stock is about 39.4% undervalued based on future cash flows. Investors should note that this model relies heavily on the accuracy of growth projections and assumptions about future cash generation, but it highlights meaningful upside for long-term holders at current levels.
Result: UNDERVALUED

Our Discounted Cash Flow (DCF) analysis suggests Equinix is undervalued by 39.4%. Track this in your watchlist or portfolio, or discover more undervalued stocks.
Approach 2: Equinix Price vs Earnings (PE Ratio)
The Price-to-Earnings (PE) ratio is often the go-to metric for valuing profitable companies, as it provides a quick way to gauge how much investors are willing to pay for each dollar of current earnings. A higher PE ratio can signal optimism about future growth, while a lower PE hints at either slower expected growth or greater risk compared to industry peers.
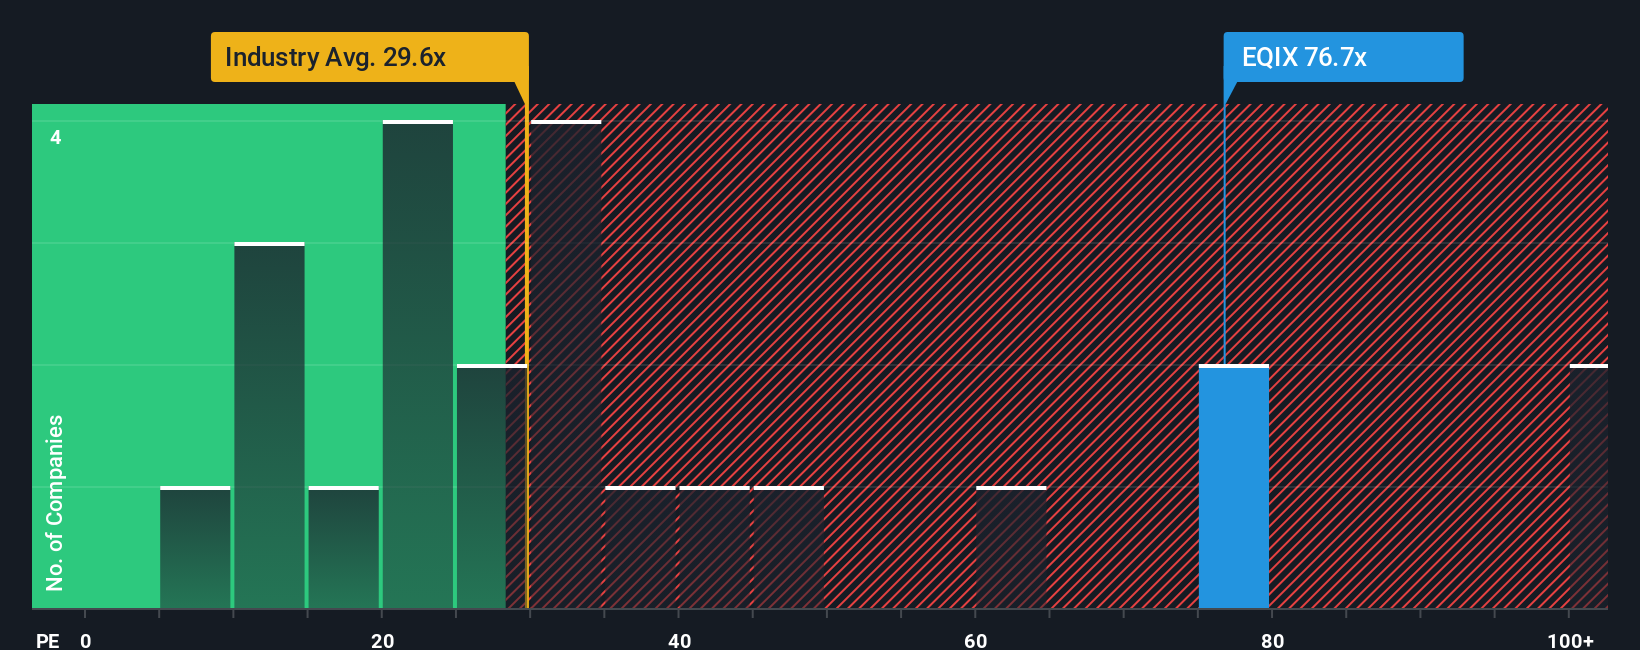
For Equinix, the current PE ratio stands at 76.1x. To put this in perspective, the industry average for Specialized REITs is just 17.8x. Equinix’s peer group averages 31.0x. At first glance, this substantial premium might look concerning, but it is essential to recognize that factors such as growth prospects, profit margins, and company-specific risks all influence what a “fair” PE ratio should be.
This is where Simply Wall St’s proprietary “Fair Ratio” comes in, setting the expected PE for Equinix at 39.6x. The Fair Ratio goes beyond basic benchmarking by factoring in Equinix’s earnings growth, industry position, profit margin, overall market capitalization, and relevant risks. As a result, it offers a much more tailored assessment of valuation than relying purely on peer or industry averages.
Comparing Equinix’s actual PE ratio of 76.1x to the Fair Ratio of 39.6x, it becomes clear that the stock is currently overvalued using this method. The gap suggests that, even after considering its strengths and growth profile, the market is demanding a significant premium above what the company’s fundamentals would typically support.
Result: OVERVALUED
PE ratios tell one story, but what if the real opportunity lies elsewhere? Discover companies where insiders are betting big on explosive growth.
Upgrade Your Decision Making: Choose your Equinix Narrative
Earlier we mentioned that there is an even better way to understand valuation, so let’s introduce you to Narratives. A Narrative brings together your view of a company’s story, including its opportunities, risks, and business outlook, with a financial forecast that leads to an estimated fair value. Rather than just focusing on numbers or ratios, Narratives help you connect what you believe about Equinix’s future to clear estimates of revenue, profit margins, and growth, and then see how that stacks up against the current share price.
Narratives are available to everyone within the Community page on Simply Wall St, where millions of investors create and update their perspectives in real time as new news, earnings, or company events arrive. This means your Narrative and its fair value always reflect the latest developments. It is an intuitive and accessible way to make buy or sell decisions. If your fair value is above today’s price, the stock may be attractive; if it’s below, it could be time for caution. For example, with Equinix, one investor’s Narrative might set a fair value as high as $1,200, while another, more cautious view could see it as low as $804. This demonstrates just how powerfully your own outlook drives your decision.
Do you think there's more to the story for Equinix? Create your own Narrative to let the Community know!
This article by Simply Wall St is general in nature. We provide commentary based on historical data and analyst forecasts only using an unbiased methodology and our articles are not intended to be financial advice. It does not constitute a recommendation to buy or sell any stock, and does not take account of your objectives, or your financial situation. We aim to bring you long-term focused analysis driven by fundamental data. Note that our analysis may not factor in the latest price-sensitive company announcements or qualitative material. Simply Wall St has no position in any stocks mentioned.
Valuation is complex, but we're here to simplify it.
Discover if Equinix might be undervalued or overvalued with our detailed analysis, featuring fair value estimates, potential risks, dividends, insider trades, and its financial condition.
Access Free AnalysisHave feedback on this article? Concerned about the content? Get in touch with us directly. Alternatively, email editorial-team@simplywallst.com
About NasdaqGS:EQIX
Equinix
Equinix, Inc. (Nasdaq: EQIX) shortens the path to boundless connectivity anywhere in the world.
Established dividend payer and fair value.
Similar Companies
Market Insights

Advertisement
Community Narratives
The Next Phase of Energy Storage: How NeoVolta Is Tackling America’s Power Crunch
Fair Value US$7.50|35.2% undervalued
MA
Community Contributor
Why EnSilica is Worth Possibly 13x its Current Price
Fair Value UK£5.00|89.8% undervalued
DO
Community Contributor
M&A Activity, Industry Diversification & A Defense Contract Monopoly Will Push BWXT For Healthy Long-Term Growth
Fair Value US$220.00|15.6% undervalued
CL
Community Contributor
A case for Cassiar Gold Corp (TSXV: GLDC) to reach CAD$8-10 before 2030 (X30-37)
Fair Value CA$10.00|97.1% undervalued
AG
Community Contributor