
Advertisement
- United States
- /
- Real Estate
- /
- NYSE:DOUG
Take Care Before Jumping Onto Douglas Elliman Inc. (NYSE:DOUG) Even Though It's 29% Cheaper
To the annoyance of some shareholders, Douglas Elliman Inc. (NYSE:DOUG) shares are down a considerable 29% in the last month, which continues a horrid run for the company. The recent drop completes a disastrous twelve months for shareholders, who are sitting on a 58% loss during that time.
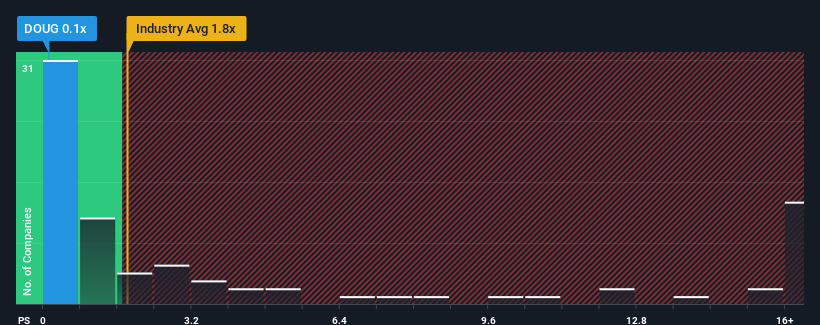
Following the heavy fall in price, Douglas Elliman may be sending buy signals at present with its price-to-sales (or "P/S") ratio of 0.1x, considering almost half of all companies in the Real Estate industry in the United States have P/S ratios greater than 1.8x and even P/S higher than 8x aren't out of the ordinary. Although, it's not wise to just take the P/S at face value as there may be an explanation why it's limited.
See our latest analysis for Douglas Elliman
What Does Douglas Elliman's Recent Performance Look Like?
Douglas Elliman could be doing better as its revenue has been going backwards lately while most other companies have been seeing positive revenue growth. The P/S ratio is probably low because investors think this poor revenue performance isn't going to get any better. If this is the case, then existing shareholders will probably struggle to get excited about the future direction of the share price.
If you'd like to see what analysts are forecasting going forward, you should check out our free report on Douglas Elliman.Do Revenue Forecasts Match The Low P/S Ratio?
There's an inherent assumption that a company should underperform the industry for P/S ratios like Douglas Elliman's to be considered reasonable.
Taking a look back first, the company's revenue growth last year wasn't something to get excited about as it posted a disappointing decline of 17%. That put a dampener on the good run it was having over the longer-term as its three-year revenue growth is still a noteworthy 23% in total. Accordingly, while they would have preferred to keep the run going, shareholders would be roughly satisfied with the medium-term rates of revenue growth.
Turning to the outlook, the next year should generate growth of 13% as estimated by the dual analysts watching the company. That's shaping up to be similar to the 12% growth forecast for the broader industry.
With this information, we find it odd that Douglas Elliman is trading at a P/S lower than the industry. It may be that most investors are not convinced the company can achieve future growth expectations.
The Key Takeaway
Douglas Elliman's P/S has taken a dip along with its share price. Typically, we'd caution against reading too much into price-to-sales ratios when settling on investment decisions, though it can reveal plenty about what other market participants think about the company.
Our examination of Douglas Elliman's revealed that its P/S remains low despite analyst forecasts of revenue growth matching the wider industry. The low P/S could be an indication that the revenue growth estimates are being questioned by the market. It appears some are indeed anticipating revenue instability, because these conditions should normally provide more support to the share price.
It's always necessary to consider the ever-present spectre of investment risk. We've identified 2 warning signs with Douglas Elliman (at least 1 which is potentially serious), and understanding them should be part of your investment process.
It's important to make sure you look for a great company, not just the first idea you come across. So if growing profitability aligns with your idea of a great company, take a peek at this free list of interesting companies with strong recent earnings growth (and a low P/E).
New: Manage All Your Stock Portfolios in One Place
We've created the ultimate portfolio companion for stock investors, and it's free.
• Connect an unlimited number of Portfolios and see your total in one currency
• Be alerted to new Warning Signs or Risks via email or mobile
• Track the Fair Value of your stocks
Have feedback on this article? Concerned about the content? Get in touch with us directly. Alternatively, email editorial-team (at) simplywallst.com.
This article by Simply Wall St is general in nature. We provide commentary based on historical data and analyst forecasts only using an unbiased methodology and our articles are not intended to be financial advice. It does not constitute a recommendation to buy or sell any stock, and does not take account of your objectives, or your financial situation. We aim to bring you long-term focused analysis driven by fundamental data. Note that our analysis may not factor in the latest price-sensitive company announcements or qualitative material. Simply Wall St has no position in any stocks mentioned.
About NYSE:DOUG
Douglas Elliman
Engages in the real estate services and property technology investment business in the United States.
Adequate balance sheet and slightly overvalued.
Similar Companies
Market Insights

Advertisement
Community Narratives
MicroVision will explode future revenue by 380.37% with a vision towards success
Fair Value US$60|98.4% undervalued
TH
Community Contributor
The Indispensable Artery for a New North American Economy
Fair Value CA$132.87|0.6% undervalued
TI
Community Contributor
Recently Updated Narratives
BL


BlackGoat on Alphabet ·
Alphabet: The Under-appreciated Compounder Hiding in Plain Sight
Fair Value:US$324.481.3% undervalued
75 followersusers have followed this narrative
3 commentsusers have commented on this narrative
1 likeusers have liked this narrative
BE


Bejgal on MINISO Group Holding ·
MINISO's fair value is projected at 26.69 with an anticipated PE ratio shift of 20x
Fair Value:US$26.6926.7% undervalued
44 followersusers have followed this narrative
3 commentsusers have commented on this narrative
0 likesusers have liked this narrative
TI


TickerTickle on Oracle ·
The Quiet Giant That Became AI’s Power Grid
Fair Value:US$389.8147.4% undervalued
9 followersusers have followed this narrative
1 commentusers have commented on this narrative
0 likesusers have liked this narrative
Popular Narratives
OS

oscargarcia on Alphabet ·
The company that turned a verb into a global necessity and basically runs the modern internet, digital ads, smartphones, maps, and AI.
Fair Value:US$3405.9% undervalued
136 followersusers have followed this narrative
6 commentsusers have commented on this narrative
18 likesusers have liked this narrative
TH

TheWallstreetKing on MicroVision ·
MicroVision will explode future revenue by 380.37% with a vision towards success
Fair Value:US$6098.4% undervalued
89 followersusers have followed this narrative
11 commentsusers have commented on this narrative
18 likesusers have liked this narrative
AN


AnalystConsensusTarget on NVIDIA ·
NVDA: Expanding AI Demand Will Drive Major Data Center Investments Through 2026
Fair Value:US$232.7922.6% undervalued
926 followersusers have followed this narrative
6 commentsusers have commented on this narrative
22 likesusers have liked this narrative