
Advertisement
- United States
- /
- Real Estate
- /
- NasdaqGS:ZG
Health Check: How Prudently Does Zillow Group (NASDAQ:ZG) Use Debt?

Legendary fund manager Li Lu (who Charlie Munger backed) once said, 'The biggest investment risk is not the volatility of prices, but whether you will suffer a permanent loss of capital.' When we think about how risky a company is, we always like to look at its use of debt, since debt overload can lead to ruin. Importantly, Zillow Group, Inc. (NASDAQ:ZG) does carry debt. But should shareholders be worried about its use of debt?
What Risk Does Debt Bring?
Debt is a tool to help businesses grow, but if a business is incapable of paying off its lenders, then it exists at their mercy. Ultimately, if the company can't fulfill its legal obligations to repay debt, shareholders could walk away with nothing. However, a more frequent (but still costly) occurrence is where a company must issue shares at bargain-basement prices, permanently diluting shareholders, just to shore up its balance sheet. Of course, the upside of debt is that it often represents cheap capital, especially when it replaces dilution in a company with the ability to reinvest at high rates of return. The first thing to do when considering how much debt a business uses is to look at its cash and debt together.
Check out our latest analysis for Zillow Group
What Is Zillow Group's Debt?
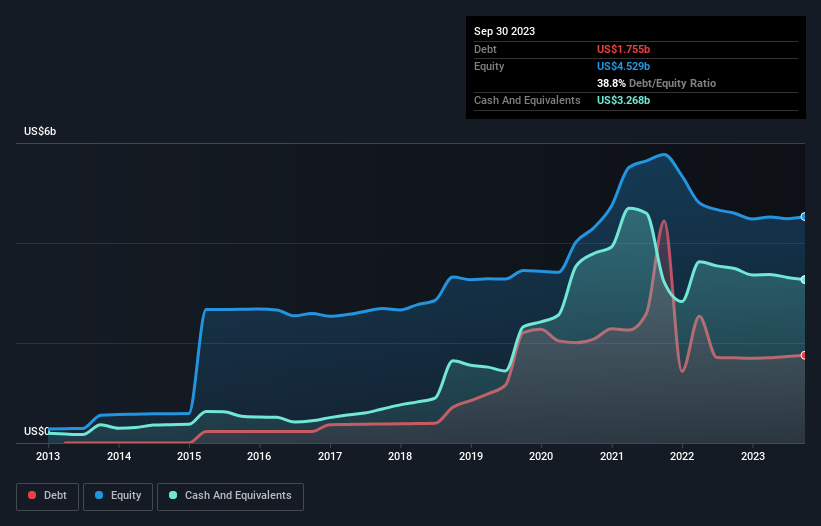
As you can see below, Zillow Group had US$1.76b of debt, at September 2023, which is about the same as the year before. You can click the chart for greater detail. But on the other hand it also has US$3.27b in cash, leading to a US$1.51b net cash position.
How Healthy Is Zillow Group's Balance Sheet?
According to the last reported balance sheet, Zillow Group had liabilities of US$941.0m due within 12 months, and liabilities of US$1.19b due beyond 12 months. On the other hand, it had cash of US$3.27b and US$97.0m worth of receivables due within a year. So it actually has US$1.24b more liquid assets than total liabilities.
This short term liquidity is a sign that Zillow Group could probably pay off its debt with ease, as its balance sheet is far from stretched. Simply put, the fact that Zillow Group has more cash than debt is arguably a good indication that it can manage its debt safely. The balance sheet is clearly the area to focus on when you are analysing debt. But ultimately the future profitability of the business will decide if Zillow Group can strengthen its balance sheet over time. So if you're focused on the future you can check out this free report showing analyst profit forecasts.
Over 12 months, Zillow Group made a loss at the EBIT level, and saw its revenue drop to US$1.9b, which is a fall of 7.4%. That's not what we would hope to see.
So How Risky Is Zillow Group?
While Zillow Group lost money on an earnings before interest and tax (EBIT) level, it actually generated positive free cash flow US$191m. So taking that on face value, and considering the net cash situation, we don't think that the stock is too risky in the near term. We'll feel more comfortable with the stock once EBIT is positive, given the lacklustre revenue growth. For riskier companies like Zillow Group I always like to keep an eye on the long term profit and revenue trends. Fortunately, you can click to see our interactive graph of its profit, revenue, and operating cashflow.
Of course, if you're the type of investor who prefers buying stocks without the burden of debt, then don't hesitate to discover our exclusive list of net cash growth stocks, today.
Valuation is complex, but we're here to simplify it.
Discover if Zillow Group might be undervalued or overvalued with our detailed analysis, featuring fair value estimates, potential risks, dividends, insider trades, and its financial condition.
Access Free AnalysisHave feedback on this article? Concerned about the content? Get in touch with us directly. Alternatively, email editorial-team (at) simplywallst.com.
This article by Simply Wall St is general in nature. We provide commentary based on historical data and analyst forecasts only using an unbiased methodology and our articles are not intended to be financial advice. It does not constitute a recommendation to buy or sell any stock, and does not take account of your objectives, or your financial situation. We aim to bring you long-term focused analysis driven by fundamental data. Note that our analysis may not factor in the latest price-sensitive company announcements or qualitative material. Simply Wall St has no position in any stocks mentioned.
About NasdaqGS:ZG
Zillow Group
Operates real estate brands in mobile applications and Websites in the United States.
Flawless balance sheet with reasonable growth potential.
Similar Companies
Market Insights

Advertisement
Community Narratives
Groundbreaking therapies that could change the treatment landscape for PTSD, fibromyalgia, MS & Alzheimer’s
Fair Value US$6.20|86.9% undervalued
CM
Community Contributor
DigitalOcean Will Grow 14% by Embracing AI with Paperspace Acquisition
Fair Value US$50.00|41.7% undervalued
NE
Community Contributor
Viant Technology: A Rising AdTech Challenger in the AI-Powered CTV Market
Fair Value US$38.61|63.2% undervalued
BL
Community Contributor
Volvo will Accelerate Forward into Electric and Autonomous Leadership in Five Years
Fair Value SEK 438.80|39.7% undervalued
UN
Community Contributor