- United States
- /
- Life Sciences
- /
- NYSE:TMO
Is Thermo Fisher Scientific Inc.'s (NYSE:TMO) Recent Stock Performance Tethered To Its Strong Fundamentals?


Most readers would already be aware that Thermo Fisher Scientific's (NYSE:TMO) stock increased significantly by 11% over the past three months. Since the market usually pay for a company’s long-term fundamentals, we decided to study the company’s key performance indicators to see if they could be influencing the market. Particularly, we will be paying attention to Thermo Fisher Scientific's ROE today.
Return on equity or ROE is a key measure used to assess how efficiently a company's management is utilizing the company's capital. In other words, it is a profitability ratio which measures the rate of return on the capital provided by the company's shareholders.
See our latest analysis for Thermo Fisher Scientific
How Is ROE Calculated?
Return on equity can be calculated by using the formula:
Return on Equity = Net Profit (from continuing operations) ÷ Shareholders' Equity
So, based on the above formula, the ROE for Thermo Fisher Scientific is:
13% = US$6.2b ÷ US$48b (Based on the trailing twelve months to June 2024).
The 'return' refers to a company's earnings over the last year. Another way to think of that is that for every $1 worth of equity, the company was able to earn $0.13 in profit.
Why Is ROE Important For Earnings Growth?
So far, we've learned that ROE is a measure of a company's profitability. Depending on how much of these profits the company reinvests or "retains", and how effectively it does so, we are then able to assess a company’s earnings growth potential. Generally speaking, other things being equal, firms with a high return on equity and profit retention, have a higher growth rate than firms that don’t share these attributes.
Thermo Fisher Scientific's Earnings Growth And 13% ROE
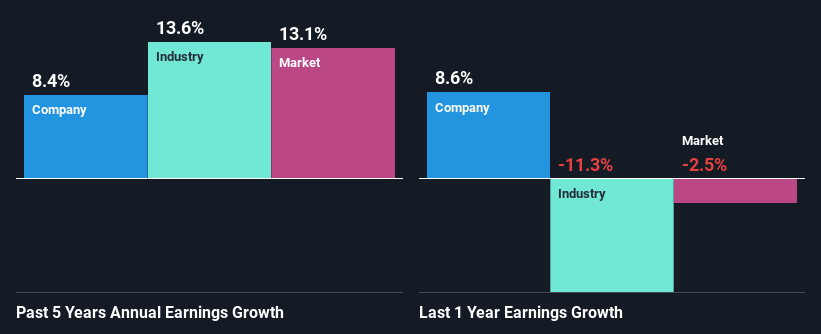
To start with, Thermo Fisher Scientific's ROE looks acceptable. On comparing with the average industry ROE of 11% the company's ROE looks pretty remarkable. Probably as a result of this, Thermo Fisher Scientific was able to see a decent growth of 8.4% over the last five years.
As a next step, we compared Thermo Fisher Scientific's net income growth with the industry and were disappointed to see that the company's growth is lower than the industry average growth of 14% in the same period.
Earnings growth is an important metric to consider when valuing a stock. The investor should try to establish if the expected growth or decline in earnings, whichever the case may be, is priced in. By doing so, they will have an idea if the stock is headed into clear blue waters or if swampy waters await. What is TMO worth today? The intrinsic value infographic in our free research report helps visualize whether TMO is currently mispriced by the market.
Is Thermo Fisher Scientific Using Its Retained Earnings Effectively?
In Thermo Fisher Scientific's case, its respectable earnings growth can probably be explained by its low three-year median payout ratio of 6.8% (or a retention ratio of 93%), which suggests that the company is investing most of its profits to grow its business.
Besides, Thermo Fisher Scientific has been paying dividends for at least ten years or more. This shows that the company is committed to sharing profits with its shareholders. Based on the latest analysts' estimates, we found that the company's future payout ratio over the next three years is expected to hold steady at 6.5%. Still, forecasts suggest that Thermo Fisher Scientific's future ROE will rise to 17% even though the the company's payout ratio is not expected to change by much.
Summary
Overall, we are quite pleased with Thermo Fisher Scientific's performance. Particularly, we like that the company is reinvesting heavily into its business, and at a high rate of return. As a result, the decent growth in its earnings is not surprising. Having said that, looking at the current analyst estimates, we found that the company's earnings are expected to gain momentum. Are these analysts expectations based on the broad expectations for the industry, or on the company's fundamentals? Click here to be taken to our analyst's forecasts page for the company.
Valuation is complex, but we're here to simplify it.
Discover if Thermo Fisher Scientific might be undervalued or overvalued with our detailed analysis, featuring fair value estimates, potential risks, dividends, insider trades, and its financial condition.
Access Free AnalysisHave feedback on this article? Concerned about the content? Get in touch with us directly. Alternatively, email editorial-team (at) simplywallst.com.
This article by Simply Wall St is general in nature. We provide commentary based on historical data and analyst forecasts only using an unbiased methodology and our articles are not intended to be financial advice. It does not constitute a recommendation to buy or sell any stock, and does not take account of your objectives, or your financial situation. We aim to bring you long-term focused analysis driven by fundamental data. Note that our analysis may not factor in the latest price-sensitive company announcements or qualitative material. Simply Wall St has no position in any stocks mentioned.
About NYSE:TMO
Thermo Fisher Scientific
Provides life sciences solutions, analytical instruments, specialty diagnostics, and laboratory products and biopharma services in the North America, Europe, Asia-Pacific, and internationally.
Undervalued with proven track record.

