Advertisement
- United States
- /
- Pharma
- /
- NYSE:TEVA
Is Teva Set for Further Gains After Strong Five-Year Rally?

Simply Wall St
Reviewed by Bailey Pemberton
If you’ve ever found yourself staring at Teva Pharmaceutical Industries’ ticker, wondering whether this could be your next smart move, you’re not alone. Teva’s story has been anything but dull lately, and the stock’s recent action is enough to put it on the radar of attentive investors. Curious about the long-term trajectory? The stock’s returned 106.5% over five years and an impressive 128.8% in the past three, hinting at a powerful turnaround. Recent shorter-term moves tell a more nuanced story, with a brief dip of -3.6% over the last week, climbing 5.1% in a month, but still down -9.3% year-to-date.
After a stretch when the broader pharmaceutical sector faced headwinds, Teva has benefited from renewed optimism around generics and specialty medicine, as well as shifts in global healthcare regulations. The market, it seems, is starting to price in lower risks and higher growth potential, fueling that strong multi-year gain.
But numbers are only part of the puzzle. When it comes to value, Teva currently posts a perfect score, 6 out of 6, for being undervalued across every major check. If you’re wondering what’s behind that score and whether it makes TEVA a buy, let’s dig into how this valuation is determined. After we tackle those methods, I’ll walk you through an even more insightful way of thinking about what Teva’s stock is really worth.
Approach 1: Teva Pharmaceutical Industries Discounted Cash Flow (DCF) Analysis
The Discounted Cash Flow (DCF) model is a widely used valuation tool that estimates a company's intrinsic value by projecting its future cash flows and discounting them back to today's dollars. For Teva Pharmaceutical Industries, this involves forecasting how much cash the company will generate in the coming years and translating those projections into a present value.
According to the latest DCF analysis, Teva's current Free Cash Flow stands at $865.85 million. Analysts have provided detailed estimates for the next several years, with projections extending even further out by Simply Wall St. By 2029, free cash flow is expected to reach around $3.83 billion, with intermediate yearly projections showing steady growth based on both analyst consensus and modeled assumptions.
After combining these cash flow estimates and discounting them appropriately, the DCF model arrives at an intrinsic value of $58.33 for Teva shares. This suggests that the stock is trading at a significant 66.9% discount to its estimated worth according to this methodology. In summary, based on its future cash flow potential, Teva appears meaningfully undervalued at today's market price.
Result: UNDERVALUED
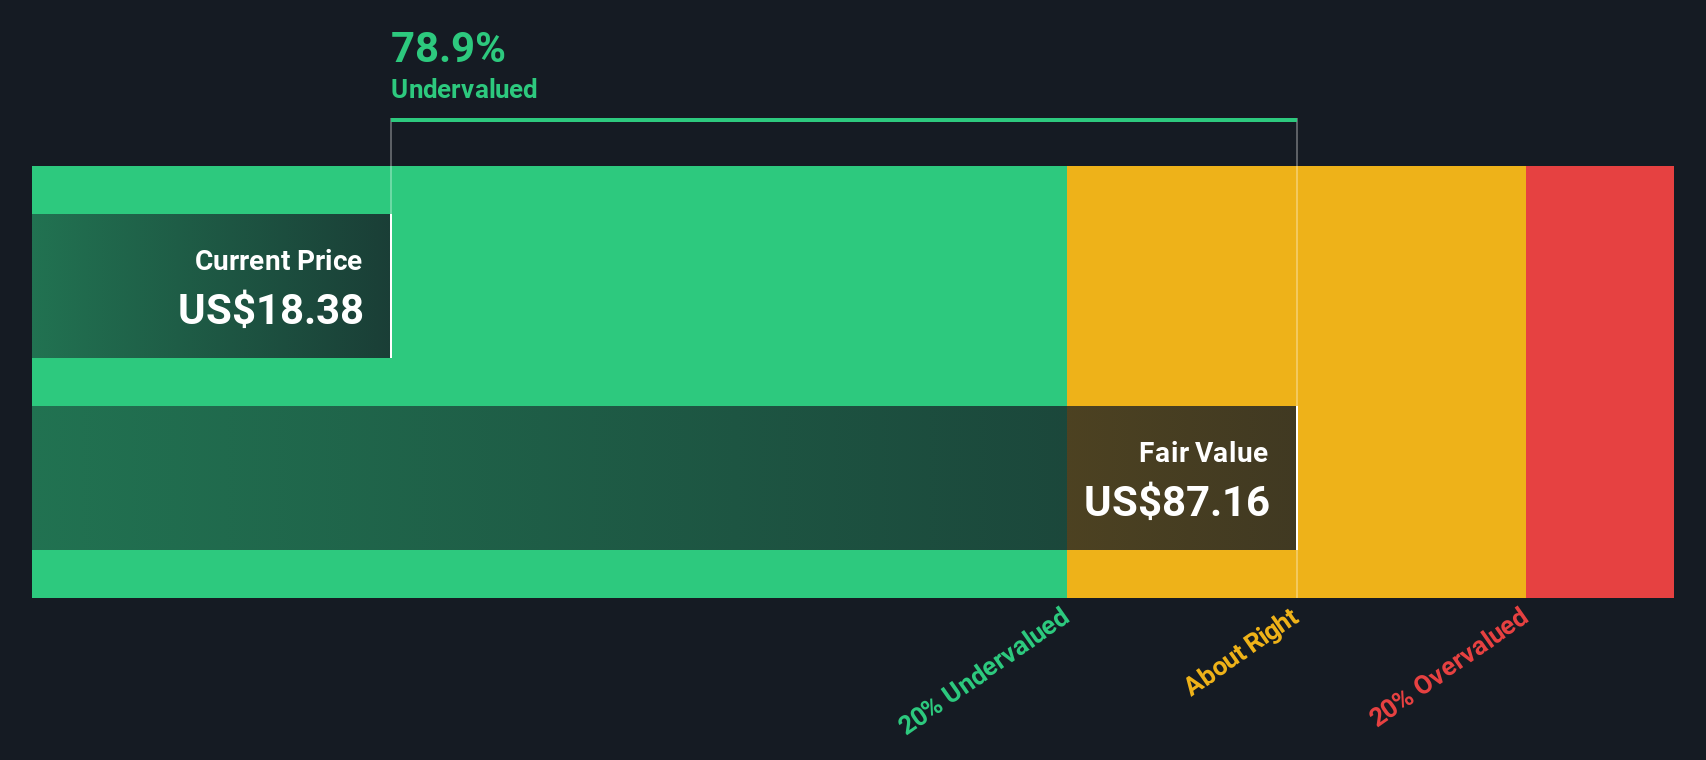
Our Discounted Cash Flow (DCF) analysis suggests Teva Pharmaceutical Industries is undervalued by 66.9%. Track this in your watchlist or portfolio, or discover more undervalued stocks.
Approach 2: Teva Pharmaceutical Industries Price vs Sales
For companies like Teva Pharmaceutical Industries that may not always post consistent profits, the Price-to-Sales (P/S) ratio is a favored valuation metric. This multiple helps investors compare how much the market is willing to pay for a company’s revenue, making it a practical tool for companies operating in cyclical or highly competitive sectors like pharmaceuticals.
Growth expectations and perceived business risks play a big role in shaping what investors consider a "normal" or "fair" P/S ratio. If the company is expected to grow sales at a faster rate or has lower risk, a higher multiple might be justified, whereas slow growth or higher risk tends to bring that number down.
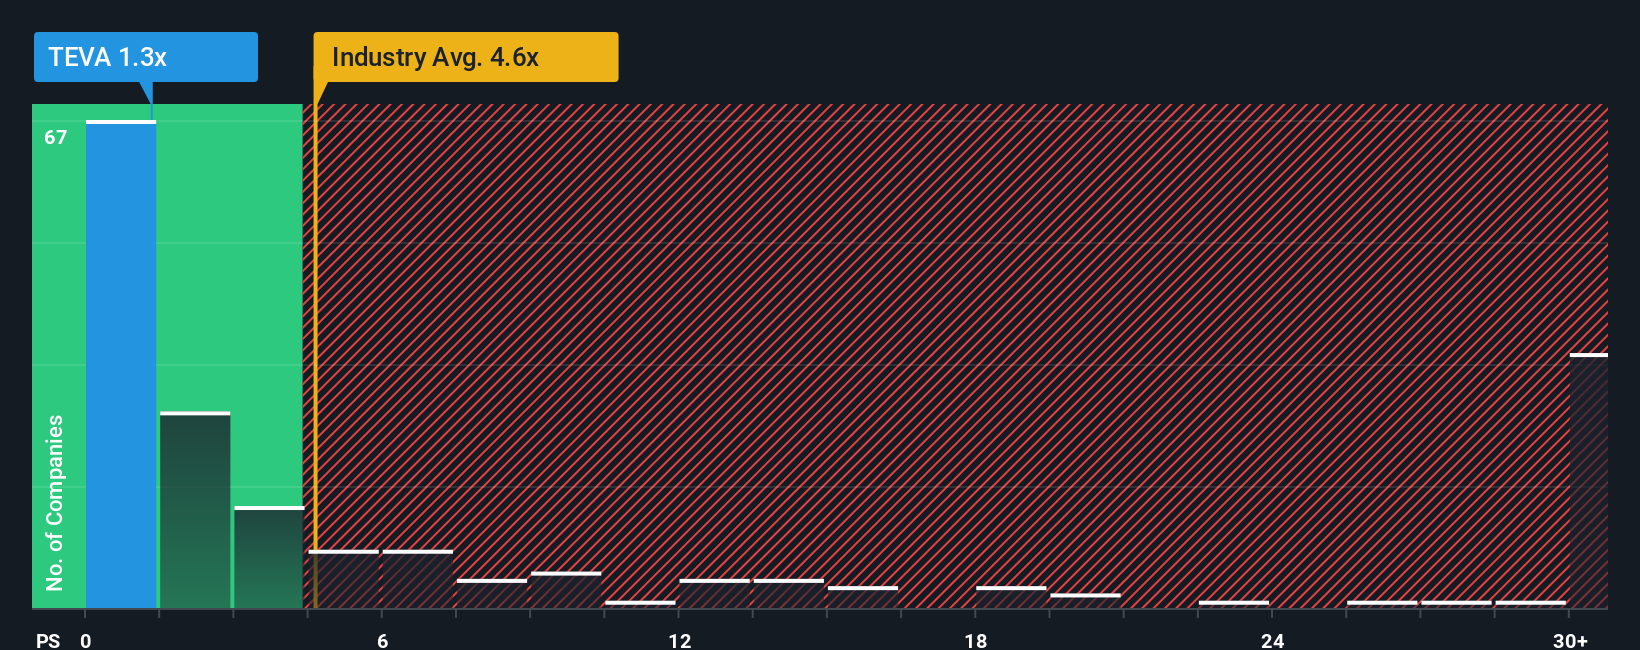
Currently, Teva trades at a P/S ratio of 1.33x, which stands well below the pharmaceutical industry average of 4.74x and is also lower than the peer average of 3.04x. However, Simply Wall St’s "Fair Ratio" takes this analysis a step further. Unlike broad benchmarks that ignore the company’s individual growth outlook, profit margin profile, and risk profile, the Fair Ratio factors in all of these attributes and provides a more customized assessment. For Teva, the Fair Ratio is 4.18x based on its specific fundamentals and market context.
With Teva’s actual P/S multiple sitting markedly below both the industry average and its own Fair Ratio, there is a strong indication the stock remains undervalued by this methodology.
Result: UNDERVALUED
PS ratios tell one story, but what if the real opportunity lies elsewhere? Discover companies where insiders are betting big on explosive growth.
Upgrade Your Decision Making: Choose your Teva Pharmaceutical Industries Narrative
Earlier we mentioned there is an even better way to understand valuation, so let's introduce you to Narratives: a simple yet powerful way for investors to frame their personal view of a company’s future. Narratives connect the company’s story with forecasts for revenue, margins, and fair value.
A Narrative is your best guess, backed by a story, about where a company like Teva is headed. It is not just about plugging numbers into a spreadsheet, but about weaving Teva’s business drivers, risks, and opportunities into a clear outlook. This links what you believe will happen, how the financials will play out, and how that all translates to a fair value for the stock.
Narratives are fast and accessible for everyone on Simply Wall St’s Community page, used by millions worldwide. They can help you decide when to buy or sell by comparing your own Fair Value estimate to the latest market Price. Narratives also update in real time as new news or earnings are released, so your view is always up to date.
For example, some investors may forecast aggressive biosimilar growth and see Teva worth $29 per share, while more cautious outlooks focus on debt and regulatory risks, pointing to fair values as low as $18. This ensures you can see both the bullish and bearish cases side by side.
Do you think there's more to the story for Teva Pharmaceutical Industries? Create your own Narrative to let the Community know!

This article by Simply Wall St is general in nature. We provide commentary based on historical data and analyst forecasts only using an unbiased methodology and our articles are not intended to be financial advice. It does not constitute a recommendation to buy or sell any stock, and does not take account of your objectives, or your financial situation. We aim to bring you long-term focused analysis driven by fundamental data. Note that our analysis may not factor in the latest price-sensitive company announcements or qualitative material. Simply Wall St has no position in any stocks mentioned.
Valuation is complex, but we're here to simplify it.
Discover if Teva Pharmaceutical Industries might be undervalued or overvalued with our detailed analysis, featuring fair value estimates, potential risks, dividends, insider trades, and its financial condition.
Access Free AnalysisHave feedback on this article? Concerned about the content? Get in touch with us directly. Alternatively, email editorial-team@simplywallst.com
About NYSE:TEVA
Teva Pharmaceutical Industries
Develops, manufactures, markets, and distributes generic and other medicines, and biopharmaceutical products in the United States, Europe, Israel, and internationally.
Very undervalued with reasonable growth potential.
Similar Companies
Market Insights

Advertisement
Community Narratives
Kodiak AI - a potential 100 bagger opportunity?
Fair Value US$14.00|44.7% undervalued
DA
Community Contributor
A Fair Price for a Great Business Facing Real Threats
Fair Value US$383.06|13.0% undervalued
IM
Community Contributor
AXON And Shopify Integration Will Unlock Global Mobile Advertising
Fair Value US$646.30|0% overvalued
AN
Based on Analyst Price Targets