Advertisement
- United States
- /
- Pharma
- /
- NYSE:NVO
Does Novo Nordisk’s Share Price Slump Signal a New Opportunity in 2025?

Simply Wall St
Reviewed by Bailey Pemberton
Wondering what to do with Novo Nordisk stock after its roller coaster over the past year? You are not alone. In just the last twelve months, the company's share price tumbled 52.0%, bringing the year-to-date drop to a staggering 37.4%. If you zoom out a bit though, patient investors still sit on a 71.3% gain over five years. In the short term, the past month has not been any easier, with the stock falling 10.8%. Even over just the last week it was down by 3.3% at the last close of $54.78. Volatility like this is tough to ignore. It can spook even the most seasoned investor, but it also sets up interesting opportunities for those who know where to look.
Behind the price swings, Novo Nordisk remains at the center of the diabetes and obesity treatment revolution, drawing considerable attention after a series of product pipeline updates and regulatory milestones. While shifting regulatory discussions and sector sentiment have played a part in the recent performance, long-term structural factors in healthcare innovation highlight why so many continue to watch this stock closely. All of this makes thinking carefully about Novo Nordisk’s valuation more important than ever.
By our scorecard, the company checks the undervalued box on 5 out of 6 key metrics, achieving a value score of 5 out of 6. But does that mean the market is missing something, or is there more lurking beneath the surface? Let’s dive into the different ways Novo Nordisk is valued, and stick around because at the end, I will share a way to get an even clearer picture than traditional analysis allows.
Why Novo Nordisk is lagging behind its peers
Approach 1: Novo Nordisk Discounted Cash Flow (DCF) Analysis
The Discounted Cash Flow (DCF) model is a method that projects a company’s future cash flows and discounts them back to today’s value, providing an estimate of what the business is really worth now. For Novo Nordisk, the DCF approach forecasts its ability to generate free cash flow (FCF) in coming years, using analyst estimates for the next five years as well as extrapolations beyond that point.
Currently, Novo Nordisk’s last twelve months’ free cash flow stands at DKK 68.4 billion. Projections show this could grow substantially, with analyst consensus estimating FCF to reach DKK 136 billion by 2029. This anticipated increase reflects both Novo Nordisk’s robust existing operations and the expected impact of its expanding product pipeline. Beyond 2029, the model assumes cash flows will continue to rise, although at a gradually slowing rate.
Based on these cash flow projections, the DCF yields an intrinsic value of DKK 161.66 per share. Comparing this to the current market price suggests that Novo Nordisk is trading at a 66.1% discount, indicating a significant undervaluation by the market using this methodology.
Result: UNDERVALUED
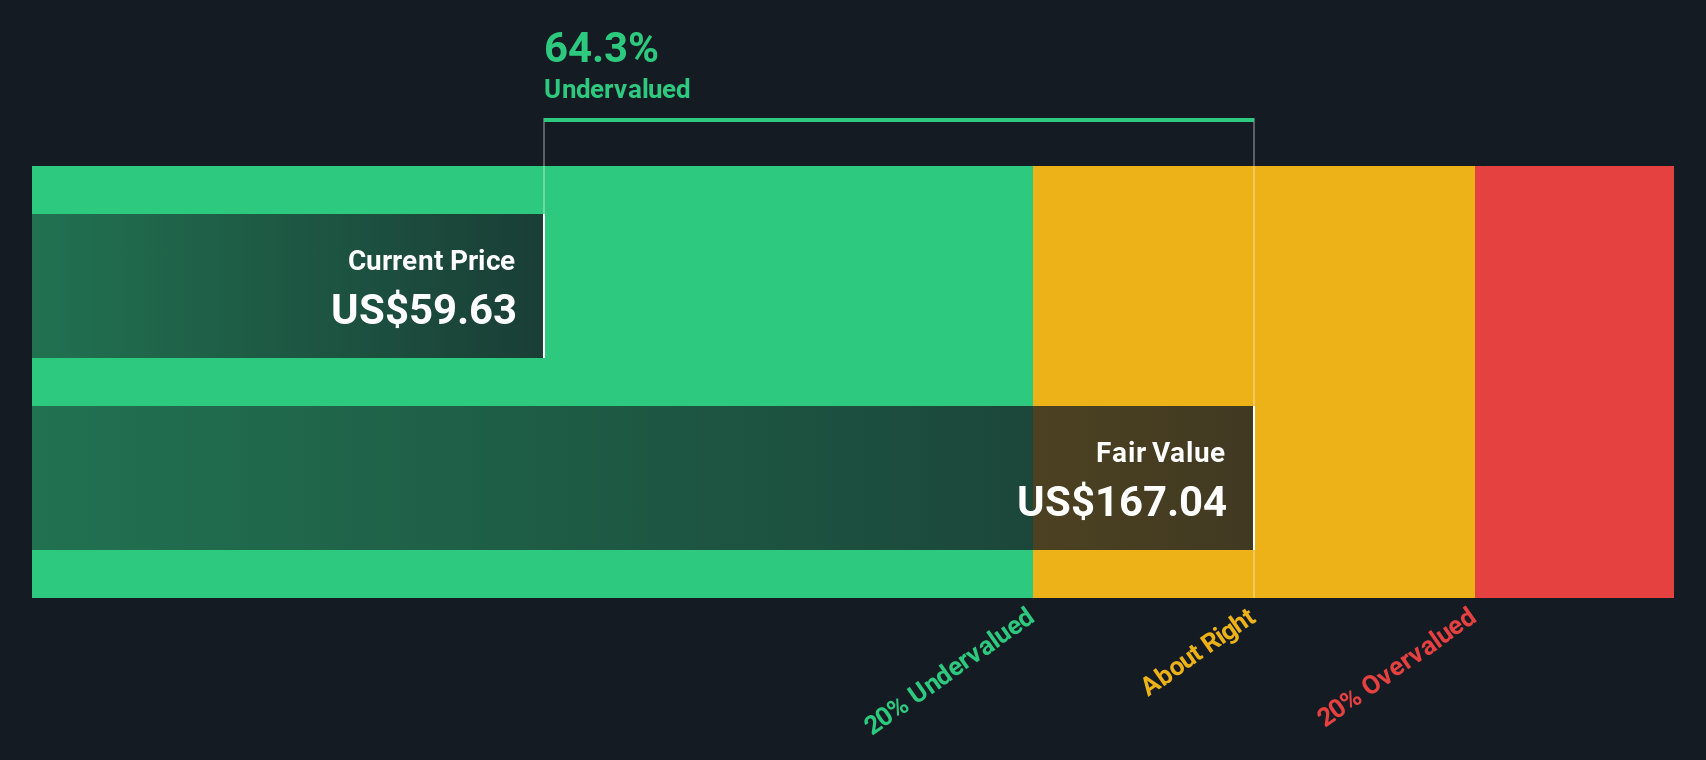
Our Discounted Cash Flow (DCF) analysis suggests Novo Nordisk is undervalued by 66.1%. Track this in your watchlist or portfolio, or discover more undervalued stocks.
Approach 2: Novo Nordisk Price vs Earnings
The Price-to-Earnings (PE) ratio is a widely used and effective valuation metric, especially for profitable companies like Novo Nordisk. It tells investors how much they are paying for each unit of the company’s earnings, making it a quick gauge for relative value when the business generates consistent profits.
Of course, what counts as a “fair” PE ratio is not set in stone. Companies with stronger expected growth or lower risk typically command higher PE ratios, while those with more uncertainty or slower expansion see their multiples compress. That is why it is important to look beyond the headline number and compare against relevant benchmarks.
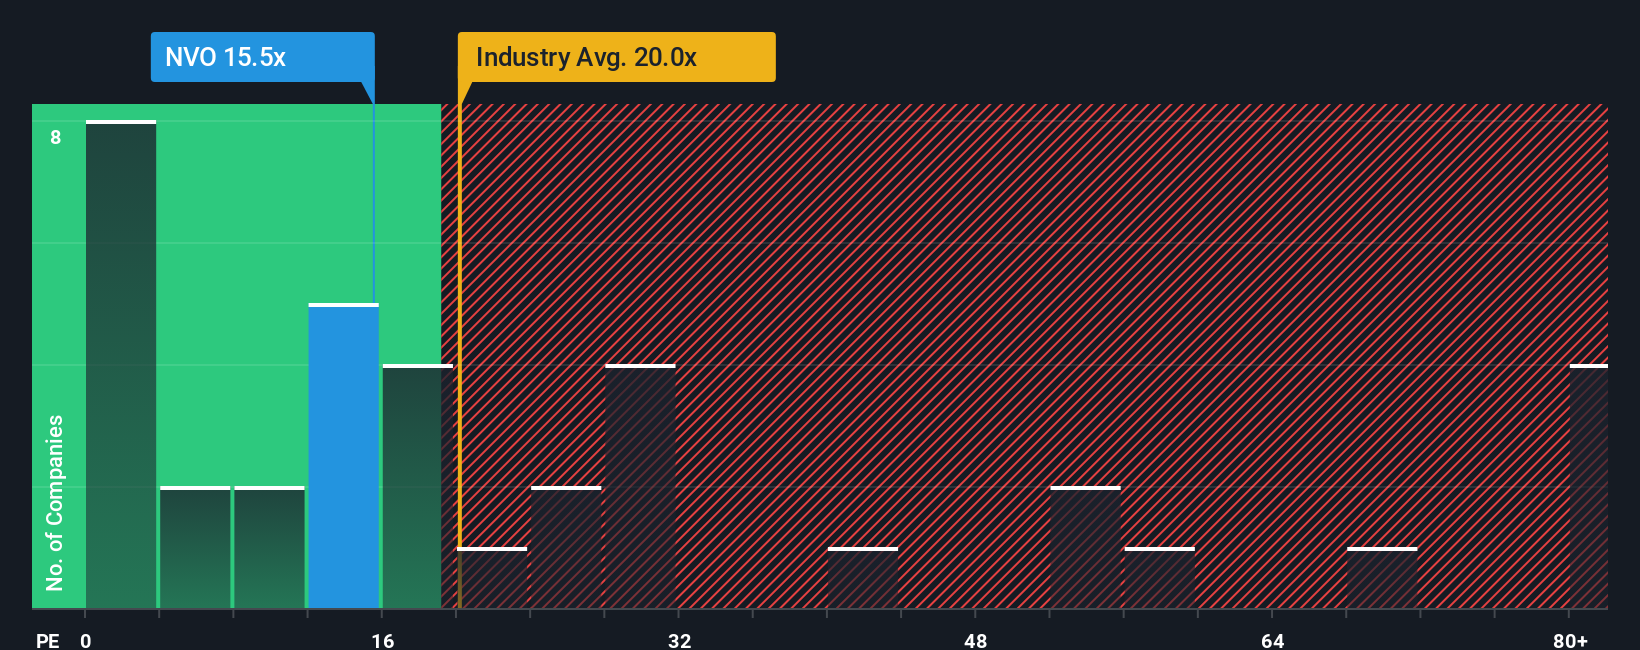
Currently, Novo Nordisk trades at a PE ratio of 14.2x. This is noticeably lower than both the Pharmaceuticals industry average of 18.4x and the peer group average of 25.4x. At first glance, this could suggest the stock is undervalued compared to its sector and competitive set. However, simply comparing to peers or industry medians can miss company-specific factors that truly drive value.
That is where the “Fair Ratio” from Simply Wall St sets itself apart. This proprietary metric estimates the PE multiple Novo Nordisk should trade at, based on a combination of its earnings growth prospects, profit margin, market cap, industry, and overall risk profile. For Novo Nordisk, the Fair Ratio is calculated at 31.1x, which is more than double its current level. Since this tailored benchmark is both higher than the actual multiple and accounts for growth, risk, and profitability, it highlights a deeper potential undervaluation versus simple peer comparisons.
Result: UNDERVALUED
PE ratios tell one story, but what if the real opportunity lies elsewhere? Discover companies where insiders are betting big on explosive growth.
Upgrade Your Decision Making: Choose your Novo Nordisk Narrative
Earlier we mentioned that there is an even better way to understand valuation, so let’s introduce you to Narratives, a dynamic approach that adds your story, forecasts, and perspective to the numbers behind Novo Nordisk.
A Narrative is an investment “story” where you set your assumptions about the company’s future, such as where revenue, earnings, and profit margins may go, and instantly see how these choices impact Novo Nordisk’s fair value.
This connects the dots from what you believe about the business, to the numbers in your forecast, and ultimately to the price you think the stock is worth today.
Narratives are simple to create and available right now on Simply Wall St’s Community page, where millions of investors build and compare their investment cases.
They help clarify when to buy or sell by directly comparing your Fair Value to the current market price and always stay up-to-date as new earnings or news are released.
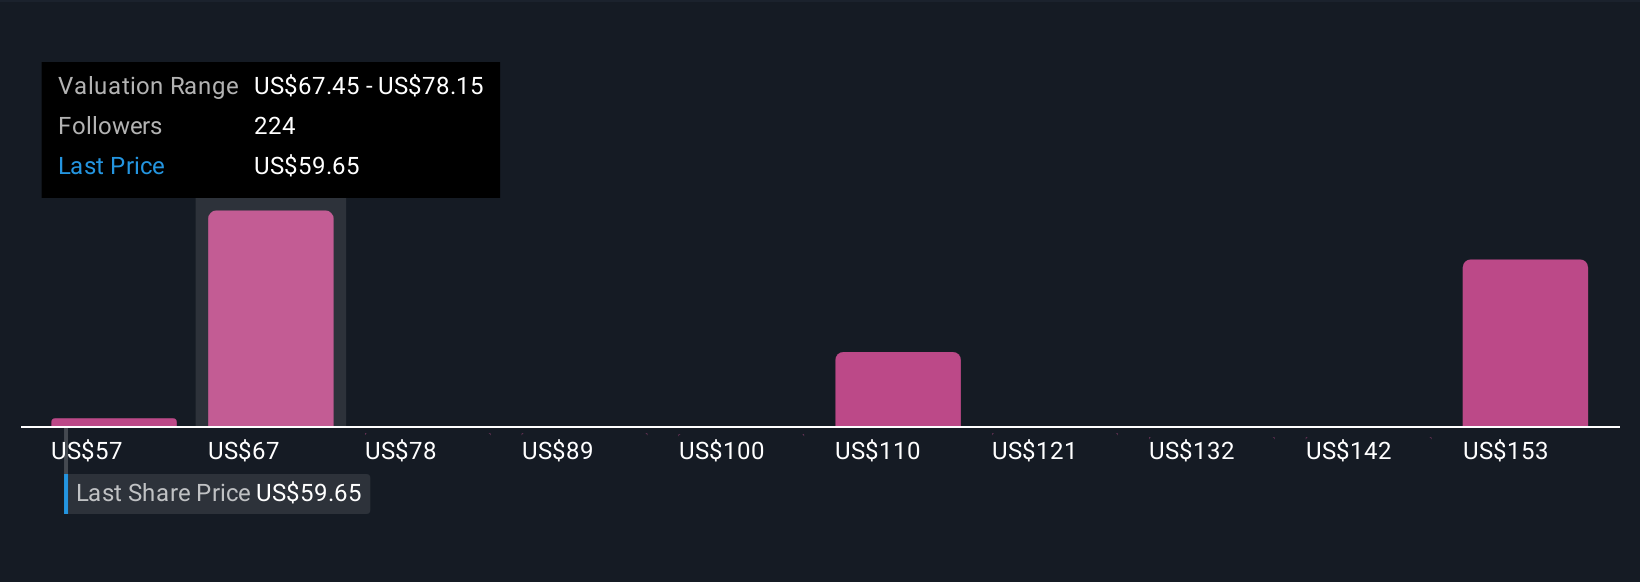
For example, some Novo Nordisk Narratives expect a Fair Value above $145, while others reflect more cautious outlooks as low as $70, showing just how personalized and actionable your investment view can be.
Do you think there's more to the story for Novo Nordisk? Create your own Narrative to let the Community know!
This article by Simply Wall St is general in nature. We provide commentary based on historical data and analyst forecasts only using an unbiased methodology and our articles are not intended to be financial advice. It does not constitute a recommendation to buy or sell any stock, and does not take account of your objectives, or your financial situation. We aim to bring you long-term focused analysis driven by fundamental data. Note that our analysis may not factor in the latest price-sensitive company announcements or qualitative material. Simply Wall St has no position in any stocks mentioned.
Valuation is complex, but we're here to simplify it.
Discover if Novo Nordisk might be undervalued or overvalued with our detailed analysis, featuring fair value estimates, potential risks, dividends, insider trades, and its financial condition.
Access Free AnalysisHave feedback on this article? Concerned about the content? Get in touch with us directly. Alternatively, email editorial-team@simplywallst.com
About NYSE:NVO
Novo Nordisk
Engages in the research and development, manufacture, and distribution of pharmaceutical products in Europe, the Middle East, Africa, Mainland China, Hong Kong, Taiwan, North America, and internationally.
Undervalued with solid track record and pays a dividend.
Similar Companies
Market Insights

Advertisement
Community Narratives
Finding The True Value Of A Logistics Powerhouse
Fair Value US$95.21|7.5% undervalued
NV
Community Contributor
Paradigm Biopharmaceuticals Will Lead Osteoarthritis Treatment with Zilosul's FDA Success
Fair Value AU$5.50|91.8% undervalued
AM
Community Contributor
Barrick Mining (ABX:CA): A Gold Hedge against a U.S. Shutdown
Fair Value CA$60.00|26.4% undervalued
GM
Community Contributor