Advertisement
- United States
- /
- Pharma
- /
- NYSE:NVO
Does Novo Nordisk’s 7% Rally Signal a Rebound Opportunity in 2025?

Simply Wall St
Reviewed by Bailey Pemberton
Are you weighing whether to scoop up shares of Novo Nordisk right now, or considering what your next move should be? You are definitely not alone. There is a lot of investor attention on this storied pharma name, especially after a whirlwind ride in its stock price. Even after a rough start to the year, with the stock down almost 32% year-to-date and over 47% compared to this time last year, something intriguing is brewing beneath the surface.
In the past week, Novo Nordisk’s stock jumped 7.2%, following a 5.1% climb over the past month. Longer-term holders still sit on impressive gains, with a 19% return over three years and a striking 76% over five years. These swings show how sentiment can shift quickly, especially in response to changing dynamics in healthcare and broader market trends, like the growing investor appetite for companies with strong innovation pipelines.
So, is this an opportunity or a potential value trap? To make sense of it all, we will dive into Novo Nordisk’s current valuation. The company earns a value score of 5 out of 6, meaning it looks undervalued by nearly every measure analysts care about. In the next section, we will unpack these valuation methods one by one, but keep an eye out because we will eventually reveal a smarter, more holistic way to determine if Novo Nordisk deserves a spot in your portfolio.
Why Novo Nordisk is lagging behind its peers
Approach 1: Novo Nordisk Discounted Cash Flow (DCF) Analysis
The Discounted Cash Flow (DCF) model estimates a company’s intrinsic value by projecting its future cash flows and discounting them back to their value today. For Novo Nordisk, this approach relies on two stages of Free Cash Flow to Equity, using both analyst estimates and longer-term forecasts.
Currently, Novo Nordisk posted trailing twelve months Free Cash Flow of DKK 68.36 billion. Analyst forecasts suggest this metric could nearly double in the next five years, potentially reaching DKK 136.14 billion by 2029, with consistent annual growth. Beyond 2029, further free cash flow projections, extrapolated via Simply Wall St, show steady expansion through 2035.
Using these projections, the DCF model estimates Novo Nordisk’s fair value at DKK 167.04 per share. When compared to the current stock price, this analysis implies that the shares are trading at a 64.3% discount to intrinsic value.
In summary, the DCF indicates Novo Nordisk is deeply undervalued relative to its projected future cash generation. Investors seeking long-term value may find this an appealing signal.
Result: UNDERVALUED
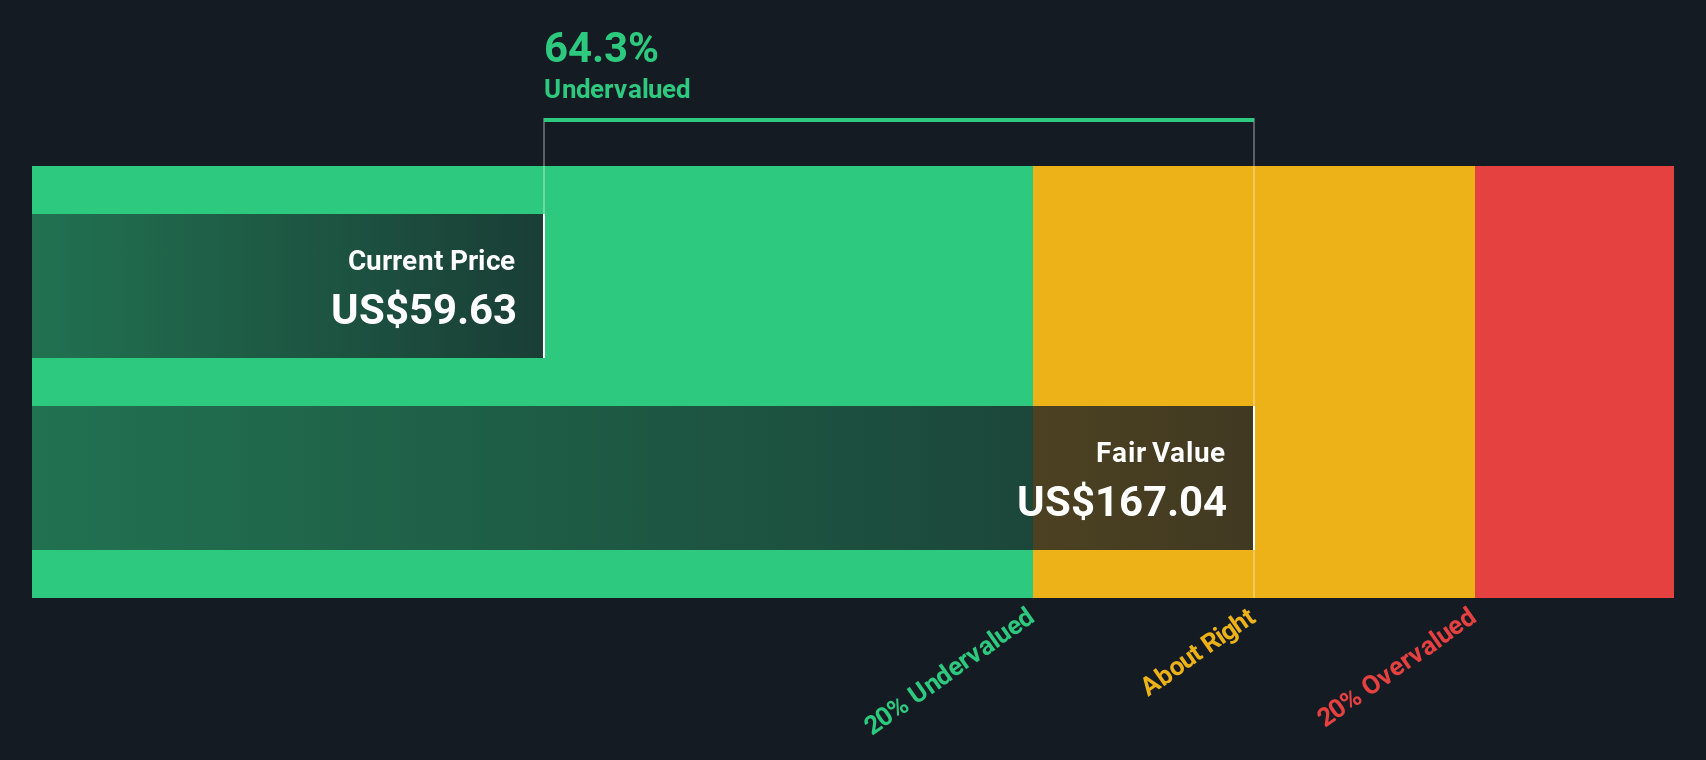
Our Discounted Cash Flow (DCF) analysis suggests Novo Nordisk is undervalued by 64.3%. Track this in your watchlist or portfolio, or discover more undervalued stocks.
Approach 2: Novo Nordisk Price vs Earnings
The Price-to-Earnings (PE) ratio is a widely used valuation metric for profitable companies because it directly compares a company’s share price to its earnings. This makes it especially useful when assessing established businesses with steady profits, like Novo Nordisk.
The PE ratio reflects how much investors are willing to pay for each dollar of earnings. Higher growth expectations or lower perceived risks often justify a higher "normal" or "fair" PE. Conversely, slower growth or higher risk typically means a lower PE is warranted.
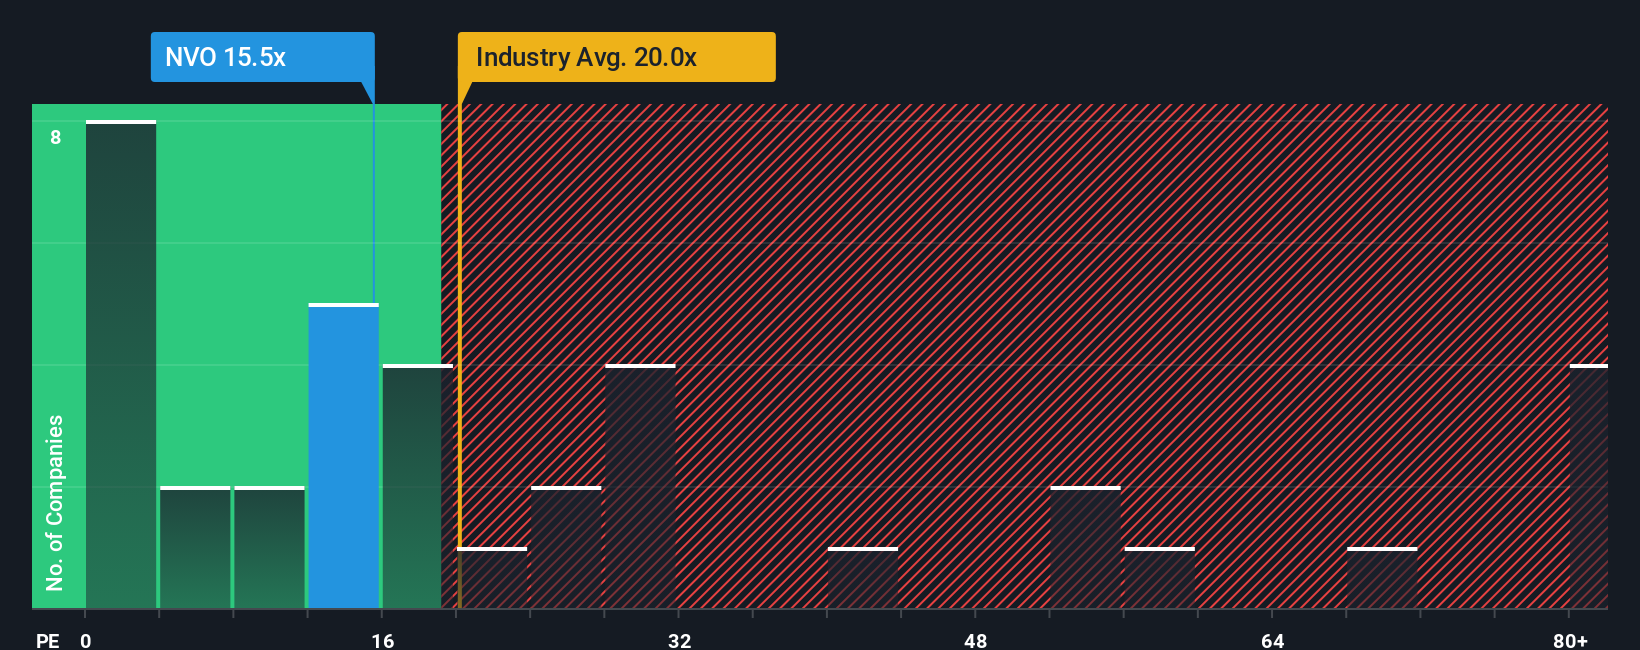
Currently, Novo Nordisk trades at a PE ratio of 15.16x. For context, the pharmaceuticals industry averages a PE of 19.77x, while the peer group commands an even higher 26.65x. At first glance, this suggests Novo Nordisk is trading at a noticeable discount to its peers and sector.
A more tailored assessment comes from Simply Wall St’s proprietary “Fair Ratio,” which models a company’s expected multiple based on factors like earnings growth, profit margins, industry dynamics, market cap, and risk profile. This approach delivers a more nuanced benchmark compared to simple peer or industry comparisons because it accounts for subtleties unique to Novo Nordisk.
Novo Nordisk’s Fair Ratio stands at 31.80x, much higher than its current 15.16x. This suggests the market is not fully recognizing the company’s strengths and potential, leaving the stock undervalued on a PE basis.
Result: UNDERVALUED
PE ratios tell one story, but what if the real opportunity lies elsewhere? Discover companies where insiders are betting big on explosive growth.
Upgrade Your Decision Making: Choose your Novo Nordisk Narrative
Earlier, we hinted that there is an even better way to understand valuation: Narratives. A Narrative is your story about a company that connects what you believe about its future with the financial forecasts and, ultimately, a fair value. Instead of focusing solely on ratios or analyst projections, Narratives let you translate your own outlook for Novo Nordisk’s future revenue, earnings, and profit margins into a clear value estimate, making your investment perspective more explicit and actionable.
This approach links the company’s real-world story, such as new drugs, competition, regulations, and strategy, with the numbers, creating a bridge between financial data and your unique viewpoint. Narratives are easy to use on Simply Wall St’s Community page, where millions of investors share and update their own scenarios. They help you decide when to buy or sell by comparing your Fair Value (from your Narrative) to the latest market price, and update in real time as the news or earnings change the outlook.
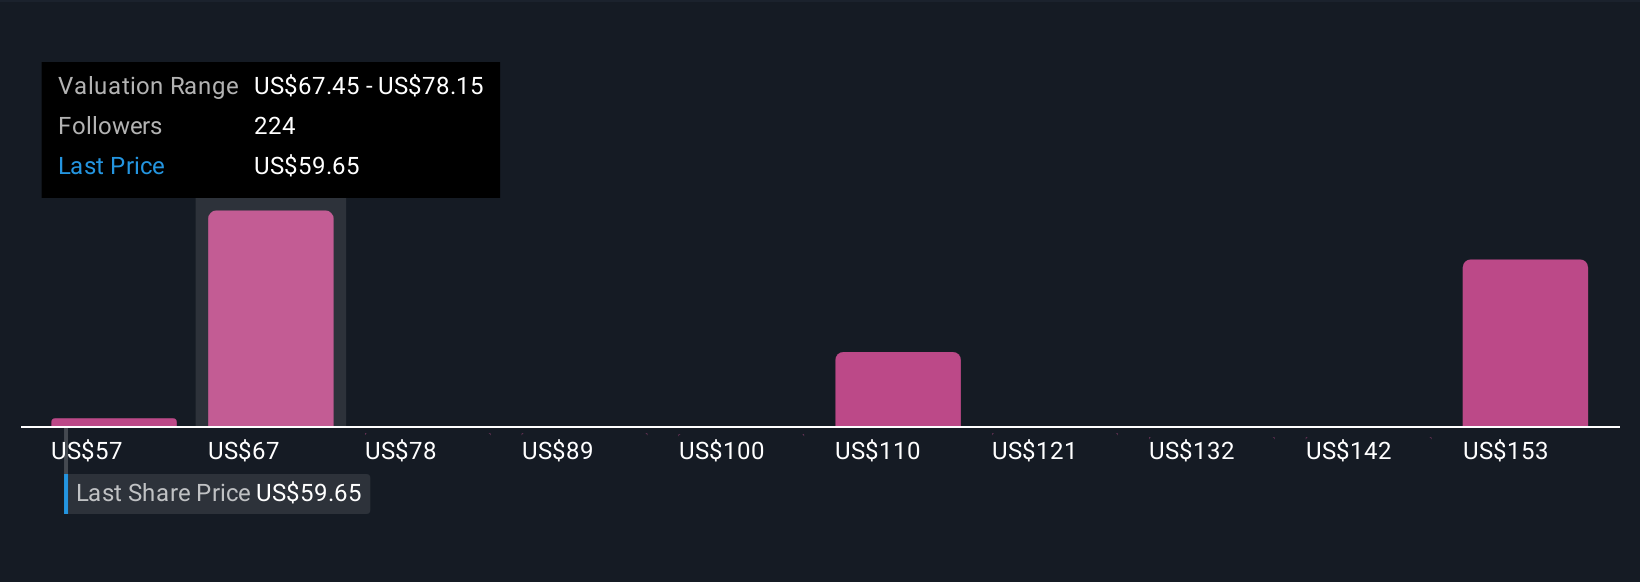
For example, one investor might believe Novo Nordisk deserves a Fair Value of $160 if new drugs succeed and growth accelerates. Another with a more cautious outlook may set it at $70 if margins shrink and competition intensifies, highlighting how Narratives put user-driven insight front and center in your decision making.
Do you think there's more to the story for Novo Nordisk? Create your own Narrative to let the Community know!
This article by Simply Wall St is general in nature. We provide commentary based on historical data and analyst forecasts only using an unbiased methodology and our articles are not intended to be financial advice. It does not constitute a recommendation to buy or sell any stock, and does not take account of your objectives, or your financial situation. We aim to bring you long-term focused analysis driven by fundamental data. Note that our analysis may not factor in the latest price-sensitive company announcements or qualitative material. Simply Wall St has no position in any stocks mentioned.
Valuation is complex, but we're here to simplify it.
Discover if Novo Nordisk might be undervalued or overvalued with our detailed analysis, featuring fair value estimates, potential risks, dividends, insider trades, and its financial condition.
Access Free AnalysisHave feedback on this article? Concerned about the content? Get in touch with us directly. Alternatively, email editorial-team@simplywallst.com
About NYSE:NVO
Novo Nordisk
Engages in the research and development, manufacture, and distribution of pharmaceutical products in Europe, the Middle East, Africa, Mainland China, Hong Kong, Taiwan, North America, and internationally.
Undervalued with solid track record and pays a dividend.
Similar Companies
Market Insights

Advertisement
Community Narratives
The Next Phase of Energy Storage: How NeoVolta Is Tackling America’s Power Crunch
Fair Value US$7.50|35.1% undervalued
MA
Community Contributor
Why EnSilica is Worth Possibly 13x its Current Price
Fair Value UK£5.00|89.8% undervalued
DO
Community Contributor
M&A Activity, Industry Diversification & A Defense Contract Monopoly Will Push BWXT For Healthy Long-Term Growth
Fair Value US$220.00|15.2% undervalued
CL
Community Contributor
A case for Cassiar Gold Corp (TSXV: GLDC) to reach CAD$8-10 before 2030 (X30-37)
Fair Value CA$10.00|96.0% undervalued
AG
Community Contributor