Advertisement
- United States
- /
- Pharma
- /
- NYSE:JNJ
Evaluating Johnson & Johnson’s Value After Recent FDA Approval and Strong Price Rally

Simply Wall St
Reviewed by Bailey Pemberton
If you've been watching Johnson & Johnson stock lately, you're probably wondering if now is the time to make a move or wait for a better entry point. With shares closing at $193.22 and a one-year return of 20.8%, it’s impressive to see how resilient J&J has been as markets juggle changing interest rates and global headlines. In just the past month, the stock is up 9.0% and it’s gained a steady 1.3% this past week, hinting at renewed optimism around the business and possibly a shift in how investors are viewing risk in the sector.
For long-term holders, the five-year rise of 53.4% and a year-to-date return of 34.2% have made J&J feel like a surprisingly steady performer in an unpredictable market. While some of this can be chalked up to the company’s broad healthcare footprint, recent news about regulatory approvals and product launches has also boosted sentiment a bit. It is becoming clear that the stock is drawing attention from those looking for both stability and growth potential.
But strong price performance alone does not answer the key question: is J&J still undervalued, or are buyers paying too much for peace of mind? On a valuation basis, J&J comes in with a score of 4 out of 6, meaning it looks undervalued in four major checks. In the next section, we’ll dig into exactly how this number was calculated. Additionally, I’ll share a perspective on valuation that goes beyond the typical methods.
Approach 1: Johnson & Johnson Discounted Cash Flow (DCF) Analysis
The Discounted Cash Flow (DCF) model is designed to estimate a company's intrinsic value by projecting its future cash flows and discounting them back to today’s dollars. For Johnson & Johnson, the DCF analysis uses a two-stage Free Cash Flow to Equity approach to account for both near-term and long-term growth.
Currently, Johnson & Johnson generates an impressive Free Cash Flow (FCF) of $18.44 Billion. Analyst estimates project FCF growth over the next decade, with 2029’s FCF forecasted at $35.5 Billion. Estimates from analysts cover only the first five years. After that, Simply Wall St extrapolates longer-term projections with gradually declining growth assumptions to reflect maturing business dynamics.
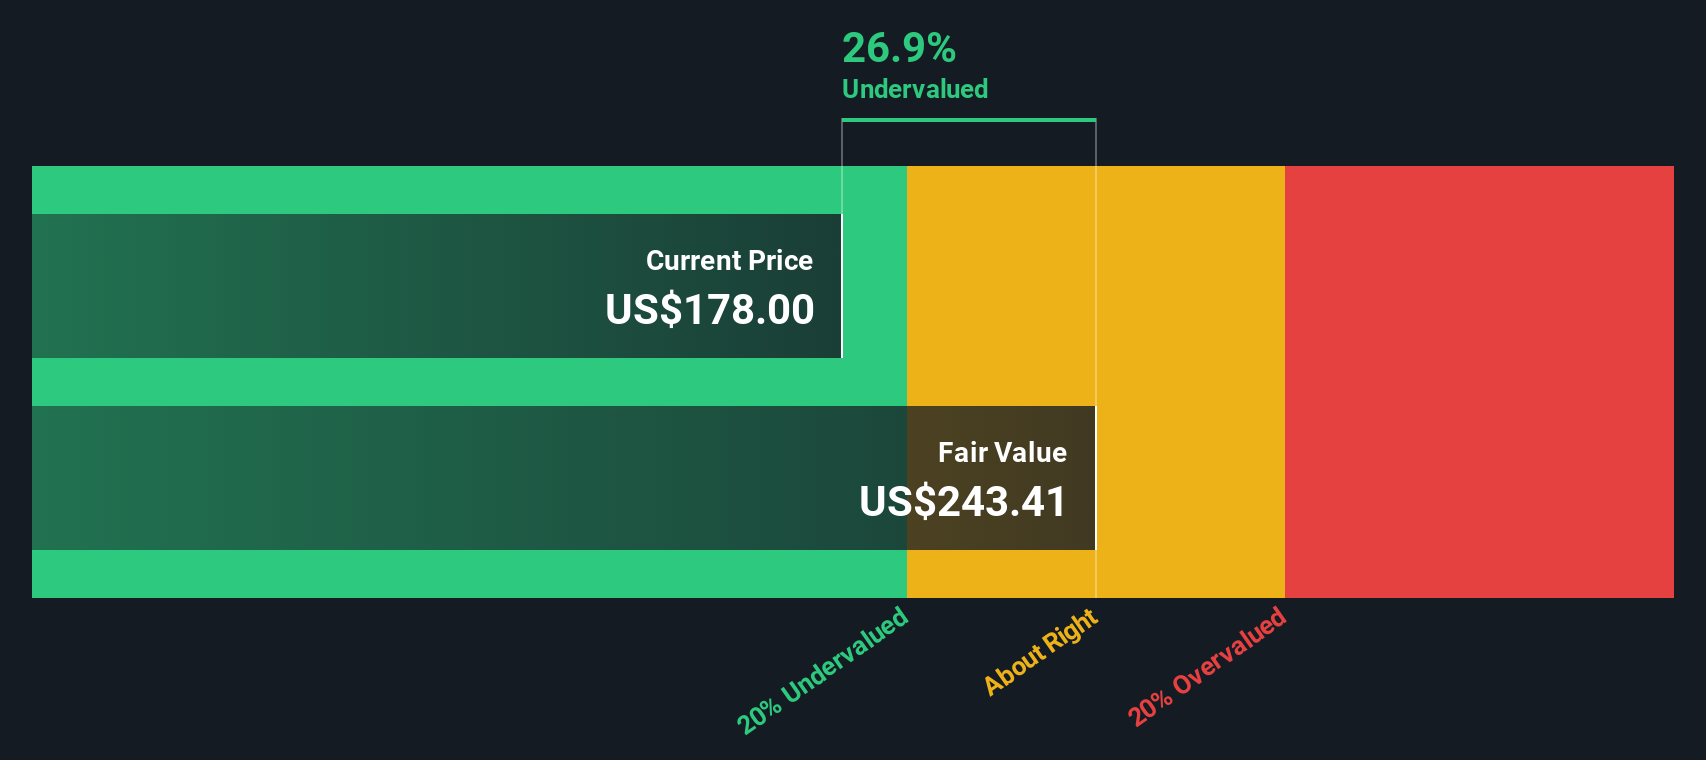
Using these projections, the DCF model calculates an intrinsic share value of $432.55. In comparison, Johnson & Johnson’s latest share price of $193.22 suggests the stock is trading at a significant 55.3% discount to its estimated fair value.
This implies that, based on underlying cash generation, J&J appears substantially undervalued in the market.
Result: UNDERVALUED
Our Discounted Cash Flow (DCF) analysis suggests Johnson & Johnson is undervalued by 55.3%. Track this in your watchlist or portfolio, or discover more undervalued stocks.
Approach 2: Johnson & Johnson Price vs Earnings
For profitable companies like Johnson & Johnson, the Price-to-Earnings (PE) ratio is a reliable and widely used valuation metric. The PE ratio reflects how much investors are willing to pay for each dollar of earnings, making it especially relevant for companies with consistent profits and a track record of stable earnings growth.
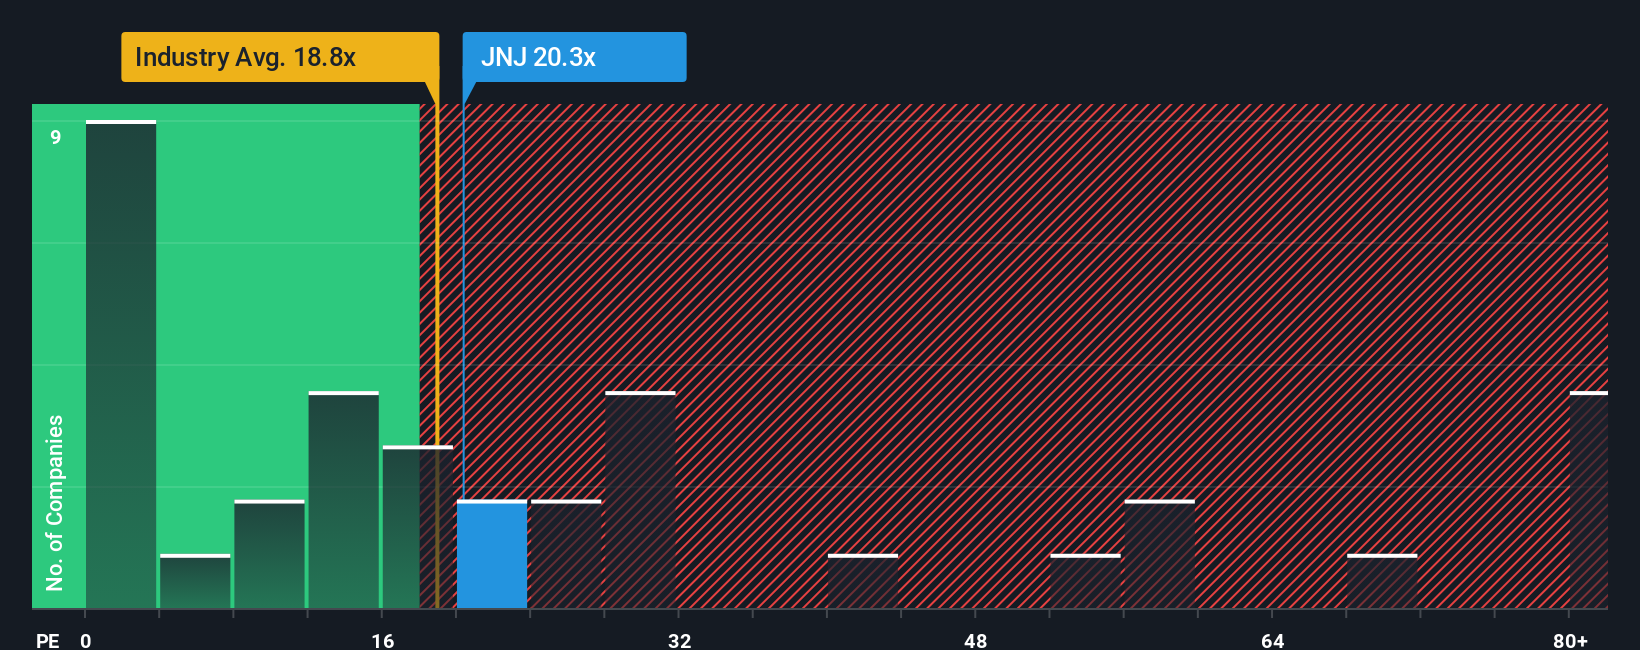
Growth expectations and perceived risk are big drivers of what constitutes a “normal” or “fair” PE. Higher expected future growth usually justifies a higher PE, while increased risk, such as legal exposure or uncertainty in the business model, drives the ratio lower. For Johnson & Johnson, the current PE ratio is 18.5x. This is slightly above the average pharmaceutical industry PE of 17.6x but below the peer group average of 23.9x, which often includes higher-growth or more volatile names.
Simply Wall St’s Fair Ratio calculation provides a proprietary benchmark in this case, a PE of 23.6x. This figure factors in not just industry dynamics, but also Johnson & Johnson’s unique earnings growth, profit margins, market cap and risk profile. Unlike straight industry or peer comparisons, the Fair Ratio is tailored for the company’s specific outlook and circumstances, giving a more complete picture of what a reasonable valuation should be.
With Johnson & Johnson trading at 18.5x earnings against a Fair Ratio of 23.6x, the shares appear to be undervalued using this more refined assessment.
Result: UNDERVALUED
PE ratios tell one story, but what if the real opportunity lies elsewhere? Discover companies where insiders are betting big on explosive growth.
Upgrade Your Decision Making: Choose your Johnson & Johnson Narrative
Earlier we mentioned there is an even better way to understand valuation, so let’s introduce you to Narratives. A Narrative is a simple yet powerful concept: it’s your investment story, your perspective on a company, expressed through your view of how its future revenue, profit margins, and fair value will evolve.
Rather than focusing only on historical numbers, Narratives link your interpretation of Johnson & Johnson’s business prospects to your financial forecast, ultimately providing your own fair value estimate. This approach is accessible to everyone, and you can easily build, compare, and discuss Narratives within the Community page on Simply Wall St, where millions of investors exchange their views.
Using Narratives, you can compare your fair value to the current share price and decide when the odds of buying or selling are in your favor. What makes Narratives especially useful is that they dynamically update as soon as new facts, such as earnings reports or breaking news, hit the market, keeping your view relevant and timely.
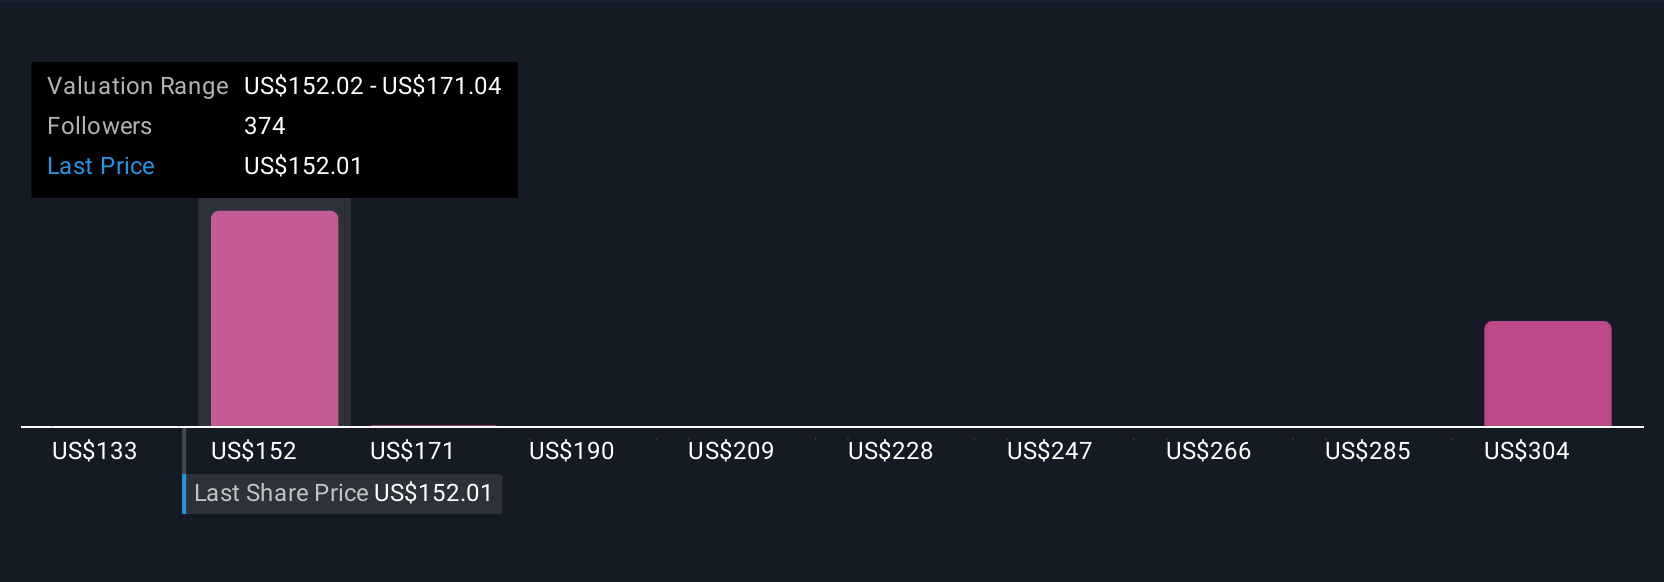
For example, one investor might believe “Johnson & Johnson’s diversified drug pipeline and focused MedTech strategy mean revenues will reach $120 billion and fair value is $174 per share,” while another might focus more on pipeline risk, estimating a fair value of $155 per share instead.
Do you think there's more to the story for Johnson & Johnson? Create your own Narrative to let the Community know!
This article by Simply Wall St is general in nature. We provide commentary based on historical data and analyst forecasts only using an unbiased methodology and our articles are not intended to be financial advice. It does not constitute a recommendation to buy or sell any stock, and does not take account of your objectives, or your financial situation. We aim to bring you long-term focused analysis driven by fundamental data. Note that our analysis may not factor in the latest price-sensitive company announcements or qualitative material. Simply Wall St has no position in any stocks mentioned.
New: Manage All Your Stock Portfolios in One Place
We've created the ultimate portfolio companion for stock investors, and it's free.
• Connect an unlimited number of Portfolios and see your total in one currency
• Be alerted to new Warning Signs or Risks via email or mobile
• Track the Fair Value of your stocks
Have feedback on this article? Concerned about the content? Get in touch with us directly. Alternatively, email editorial-team@simplywallst.com
About NYSE:JNJ
Johnson & Johnson
Engages in the research and development, manufacture, and sale of various products in the healthcare field worldwide.
Solid track record established dividend payer.
Similar Companies
Market Insights

Advertisement
Community Narratives
Kodiak AI - a potential 100 bagger opportunity?
Fair Value US$14.00|44.7% undervalued
DA
Community Contributor
A Fair Price for a Great Business Facing Real Threats
Fair Value US$383.06|13.0% undervalued
IM
Community Contributor
AXON And Shopify Integration Will Unlock Global Mobile Advertising
Fair Value US$646.30|0% overvalued
AN
Based on Analyst Price Targets