- United States
- /
- Biotech
- /
- NasdaqGM:ZNTL
Is Zentalis Pharmaceuticals, Inc. (NASDAQ:ZNTL) Trading At A 45% Discount?


Key Insights
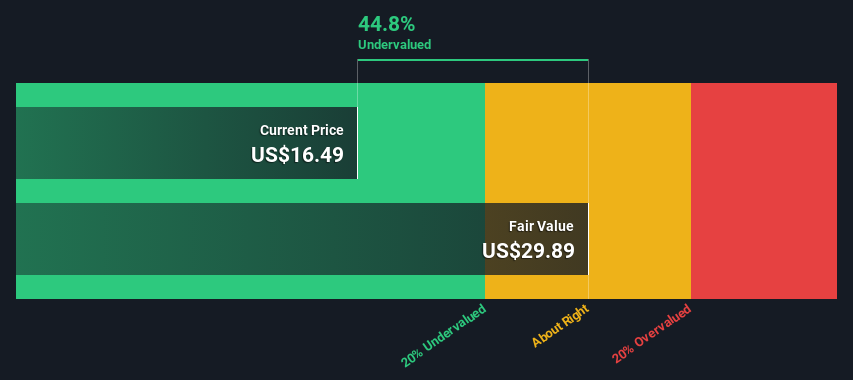
- Zentalis Pharmaceuticals' estimated fair value is US$29.89 based on 2 Stage Free Cash Flow to Equity
- Current share price of US$16.49 suggests Zentalis Pharmaceuticals is potentially 45% undervalued
- Our fair value estimate is 12% lower than Zentalis Pharmaceuticals' analyst price target of US$34.10
Does the January share price for Zentalis Pharmaceuticals, Inc. (NASDAQ:ZNTL) reflect what it's really worth? Today, we will estimate the stock's intrinsic value by taking the forecast future cash flows of the company and discounting them back to today's value. The Discounted Cash Flow (DCF) model is the tool we will apply to do this. There's really not all that much to it, even though it might appear quite complex.
We would caution that there are many ways of valuing a company and, like the DCF, each technique has advantages and disadvantages in certain scenarios. For those who are keen learners of equity analysis, the Simply Wall St analysis model here may be something of interest to you.
See our latest analysis for Zentalis Pharmaceuticals
Crunching The Numbers
We're using the 2-stage growth model, which simply means we take in account two stages of company's growth. In the initial period the company may have a higher growth rate and the second stage is usually assumed to have a stable growth rate. To begin with, we have to get estimates of the next ten years of cash flows. Where possible we use analyst estimates, but when these aren't available we extrapolate the previous free cash flow (FCF) from the last estimate or reported value. We assume companies with shrinking free cash flow will slow their rate of shrinkage, and that companies with growing free cash flow will see their growth rate slow, over this period. We do this to reflect that growth tends to slow more in the early years than it does in later years.
Generally we assume that a dollar today is more valuable than a dollar in the future, so we need to discount the sum of these future cash flows to arrive at a present value estimate:
10-year free cash flow (FCF) estimate
| 2024 | 2025 | 2026 | 2027 | 2028 | 2029 | 2030 | 2031 | 2032 | 2033 | |
| Levered FCF ($, Millions) | -US$266.3m | -US$303.6m | -US$271.0m | -US$123.6m | US$56.4m | US$82.5m | US$109.8m | US$135.9m | US$159.4m | US$179.7m |
| Growth Rate Estimate Source | Analyst x2 | Analyst x2 | Analyst x2 | Analyst x2 | Analyst x2 | Est @ 46.21% | Est @ 33.02% | Est @ 23.78% | Est @ 17.31% | Est @ 12.78% |
| Present Value ($, Millions) Discounted @ 6.2% | -US$251 | -US$269 | -US$226 | -US$97.1 | US$41.7 | US$57.5 | US$71.9 | US$83.8 | US$92.6 | US$98.3 |
("Est" = FCF growth rate estimated by Simply Wall St)
Present Value of 10-year Cash Flow (PVCF) = -US$397m
We now need to calculate the Terminal Value, which accounts for all the future cash flows after this ten year period. The Gordon Growth formula is used to calculate Terminal Value at a future annual growth rate equal to the 5-year average of the 10-year government bond yield of 2.2%. We discount the terminal cash flows to today's value at a cost of equity of 6.2%.
Terminal Value (TV)= FCF2033 × (1 + g) ÷ (r – g) = US$180m× (1 + 2.2%) ÷ (6.2%– 2.2%) = US$4.6b
Present Value of Terminal Value (PVTV)= TV / (1 + r)10= US$4.6b÷ ( 1 + 6.2%)10= US$2.5b
The total value, or equity value, is then the sum of the present value of the future cash flows, which in this case is US$2.1b. In the final step we divide the equity value by the number of shares outstanding. Compared to the current share price of US$16.5, the company appears quite undervalued at a 45% discount to where the stock price trades currently. Valuations are imprecise instruments though, rather like a telescope - move a few degrees and end up in a different galaxy. Do keep this in mind.
The Assumptions
The calculation above is very dependent on two assumptions. The first is the discount rate and the other is the cash flows. Part of investing is coming up with your own evaluation of a company's future performance, so try the calculation yourself and check your own assumptions. The DCF also does not consider the possible cyclicality of an industry, or a company's future capital requirements, so it does not give a full picture of a company's potential performance. Given that we are looking at Zentalis Pharmaceuticals as potential shareholders, the cost of equity is used as the discount rate, rather than the cost of capital (or weighted average cost of capital, WACC) which accounts for debt. In this calculation we've used 6.2%, which is based on a levered beta of 0.800. Beta is a measure of a stock's volatility, compared to the market as a whole. We get our beta from the industry average beta of globally comparable companies, with an imposed limit between 0.8 and 2.0, which is a reasonable range for a stable business.
SWOT Analysis for Zentalis Pharmaceuticals
- Currently debt free.
- Shareholders have been diluted in the past year.
- Forecast to reduce losses next year.
- Trading below our estimate of fair value by more than 20%.
- Significant insider buying over the past 3 months.
- Has less than 3 years of cash runway based on current free cash flow.
- Not expected to become profitable over the next 3 years.
Next Steps:
Although the valuation of a company is important, it shouldn't be the only metric you look at when researching a company. It's not possible to obtain a foolproof valuation with a DCF model. Instead the best use for a DCF model is to test certain assumptions and theories to see if they would lead to the company being undervalued or overvalued. For example, changes in the company's cost of equity or the risk free rate can significantly impact the valuation. Can we work out why the company is trading at a discount to intrinsic value? For Zentalis Pharmaceuticals, we've put together three pertinent elements you should look at:
- Risks: For example, we've discovered 4 warning signs for Zentalis Pharmaceuticals (1 can't be ignored!) that you should be aware of before investing here.
- Future Earnings: How does ZNTL's growth rate compare to its peers and the wider market? Dig deeper into the analyst consensus number for the upcoming years by interacting with our free analyst growth expectation chart.
- Other Solid Businesses: Low debt, high returns on equity and good past performance are fundamental to a strong business. Why not explore our interactive list of stocks with solid business fundamentals to see if there are other companies you may not have considered!
PS. Simply Wall St updates its DCF calculation for every American stock every day, so if you want to find the intrinsic value of any other stock just search here.
Valuation is complex, but we're here to simplify it.
Discover if Zentalis Pharmaceuticals might be undervalued or overvalued with our detailed analysis, featuring fair value estimates, potential risks, dividends, insider trades, and its financial condition.
Access Free AnalysisHave feedback on this article? Concerned about the content? Get in touch with us directly. Alternatively, email editorial-team (at) simplywallst.com.
This article by Simply Wall St is general in nature. We provide commentary based on historical data and analyst forecasts only using an unbiased methodology and our articles are not intended to be financial advice. It does not constitute a recommendation to buy or sell any stock, and does not take account of your objectives, or your financial situation. We aim to bring you long-term focused analysis driven by fundamental data. Note that our analysis may not factor in the latest price-sensitive company announcements or qualitative material. Simply Wall St has no position in any stocks mentioned.
About NasdaqGM:ZNTL
Zentalis Pharmaceuticals
A clinical-stage biopharmaceutical company, focuses on discovering and developing small molecule therapeutics for the treatment of various cancers.
Flawless balance sheet and good value.

