
Advertisement
- United States
- /
- Biotech
- /
- NasdaqGS:YMAB
Investors Don't See Light At End Of Y-mAbs Therapeutics, Inc.'s (NASDAQ:YMAB) Tunnel And Push Stock Down 29%

The Y-mAbs Therapeutics, Inc. (NASDAQ:YMAB) share price has fared very poorly over the last month, falling by a substantial 29%. Looking at the bigger picture, even after this poor month the stock is up 48% in the last year.
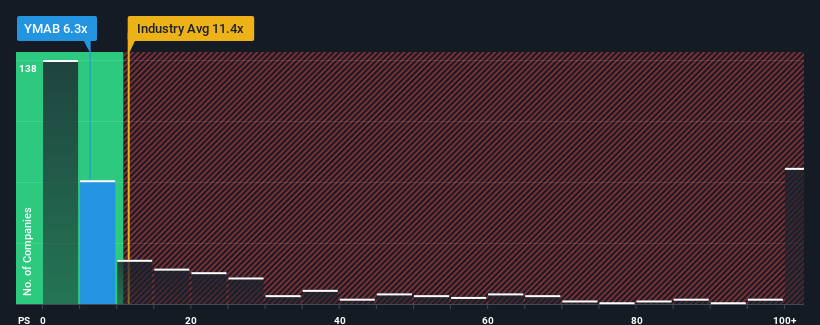
After such a large drop in price, Y-mAbs Therapeutics may be sending bullish signals at the moment with its price-to-sales (or "P/S") ratio of 6.3x, since almost half of all companies in the Biotechs industry in the United States have P/S ratios greater than 11.4x and even P/S higher than 67x are not unusual. However, the P/S might be low for a reason and it requires further investigation to determine if it's justified.
See our latest analysis for Y-mAbs Therapeutics
What Does Y-mAbs Therapeutics' Recent Performance Look Like?
Y-mAbs Therapeutics could be doing better as it's been growing revenue less than most other companies lately. It seems that many are expecting the uninspiring revenue performance to persist, which has repressed the growth of the P/S ratio. If this is the case, then existing shareholders will probably struggle to get excited about the future direction of the share price.
If you'd like to see what analysts are forecasting going forward, you should check out our free report on Y-mAbs Therapeutics.How Is Y-mAbs Therapeutics' Revenue Growth Trending?
In order to justify its P/S ratio, Y-mAbs Therapeutics would need to produce sluggish growth that's trailing the industry.
Taking a look back first, we see that the company managed to grow revenues by a handy 13% last year. Pleasingly, revenue has also lifted 223% in aggregate from three years ago, partly thanks to the last 12 months of growth. So we can start by confirming that the company has done a great job of growing revenues over that time.
Shifting to the future, estimates from the six analysts covering the company suggest revenue should grow by 15% per annum over the next three years. Meanwhile, the rest of the industry is forecast to expand by 208% per annum, which is noticeably more attractive.
With this information, we can see why Y-mAbs Therapeutics is trading at a P/S lower than the industry. Apparently many shareholders weren't comfortable holding on while the company is potentially eyeing a less prosperous future.
The Key Takeaway
The southerly movements of Y-mAbs Therapeutics' shares means its P/S is now sitting at a pretty low level. Typically, we'd caution against reading too much into price-to-sales ratios when settling on investment decisions, though it can reveal plenty about what other market participants think about the company.
As expected, our analysis of Y-mAbs Therapeutics' analyst forecasts confirms that the company's underwhelming revenue outlook is a major contributor to its low P/S. At this stage investors feel the potential for an improvement in revenue isn't great enough to justify a higher P/S ratio. The company will need a change of fortune to justify the P/S rising higher in the future.
And what about other risks? Every company has them, and we've spotted 4 warning signs for Y-mAbs Therapeutics (of which 1 is concerning!) you should know about.
It's important to make sure you look for a great company, not just the first idea you come across. So if growing profitability aligns with your idea of a great company, take a peek at this free list of interesting companies with strong recent earnings growth (and a low P/E).
New: Manage All Your Stock Portfolios in One Place
We've created the ultimate portfolio companion for stock investors, and it's free.
• Connect an unlimited number of Portfolios and see your total in one currency
• Be alerted to new Warning Signs or Risks via email or mobile
• Track the Fair Value of your stocks
Have feedback on this article? Concerned about the content? Get in touch with us directly. Alternatively, email editorial-team (at) simplywallst.com.
This article by Simply Wall St is general in nature. We provide commentary based on historical data and analyst forecasts only using an unbiased methodology and our articles are not intended to be financial advice. It does not constitute a recommendation to buy or sell any stock, and does not take account of your objectives, or your financial situation. We aim to bring you long-term focused analysis driven by fundamental data. Note that our analysis may not factor in the latest price-sensitive company announcements or qualitative material. Simply Wall St has no position in any stocks mentioned.
About NasdaqGS:YMAB
Y-mAbs Therapeutics
A commercial-stage biopharmaceutical company, focuses on the development and commercialization of radioimmunotherapy and antibody based therapeutic products for the treatment of cancer.
Flawless balance sheet and fair value.
Similar Companies
Market Insights

Advertisement
Community Narratives
WhiteCap Is Positioned To Profit Regardless Of Trump's Policy 
Fair Value CA$22.60|61.6% undervalued
ST
Equity Analyst and Writer
Microsoft's Evolution Will Drive Revenue to New Heights Fueled by AI
Fair Value US$360.00|28.6% overvalued
BR
Community Contributor
A CASE FOR USD$2.50 (CAD$3.44) BY 2028 (A 5-10 BAGGER)
Fair Value CA$3.44|87.5% undervalued
AG
Community Contributor