
Advertisement
David Iben put it well when he said, 'Volatility is not a risk we care about. What we care about is avoiding the permanent loss of capital.' It's only natural to consider a company's balance sheet when you examine how risky it is, since debt is often involved when a business collapses. Importantly, Xencor, Inc. (NASDAQ:XNCR) does carry debt. But the more important question is: how much risk is that debt creating?
What Risk Does Debt Bring?
Debt is a tool to help businesses grow, but if a business is incapable of paying off its lenders, then it exists at their mercy. In the worst case scenario, a company can go bankrupt if it cannot pay its creditors. However, a more frequent (but still costly) occurrence is where a company must issue shares at bargain-basement prices, permanently diluting shareholders, just to shore up its balance sheet. Of course, plenty of companies use debt to fund growth, without any negative consequences. The first step when considering a company's debt levels is to consider its cash and debt together.
Check out our latest analysis for Xencor
What Is Xencor's Net Debt?
You can click the graphic below for the historical numbers, but it shows that as of March 2024 Xencor had US$20.4m of debt, an increase on none, over one year. However, it does have US$535.9m in cash offsetting this, leading to net cash of US$515.5m.
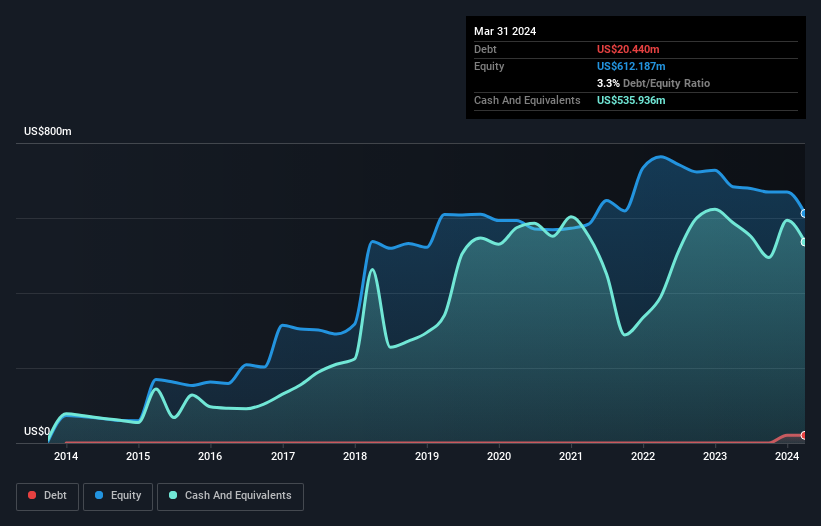
How Healthy Is Xencor's Balance Sheet?
According to the last reported balance sheet, Xencor had liabilities of US$79.4m due within 12 months, and liabilities of US$192.7m due beyond 12 months. Offsetting this, it had US$535.9m in cash and US$9.58m in receivables that were due within 12 months. So it actually has US$273.4m more liquid assets than total liabilities.
This surplus suggests that Xencor is using debt in a way that is appears to be both safe and conservative. Because it has plenty of assets, it is unlikely to have trouble with its lenders. Simply put, the fact that Xencor has more cash than debt is arguably a good indication that it can manage its debt safely. When analysing debt levels, the balance sheet is the obvious place to start. But it is future earnings, more than anything, that will determine Xencor's ability to maintain a healthy balance sheet going forward. So if you want to see what the professionals think, you might find this free report on analyst profit forecasts to be interesting.
Over 12 months, Xencor reported revenue of US$162m, which is a gain of 65%, although it did not report any earnings before interest and tax. With any luck the company will be able to grow its way to profitability.
So How Risky Is Xencor?
While Xencor lost money on an earnings before interest and tax (EBIT) level, it actually generated positive free cash flow US$49m. So taking that on face value, and considering the net cash situation, we don't think that the stock is too risky in the near term. We think its revenue growth of 65% is a good sign. There's no doubt fast top line growth can cure all manner of ills, for a stock. The balance sheet is clearly the area to focus on when you are analysing debt. But ultimately, every company can contain risks that exist outside of the balance sheet. Be aware that Xencor is showing 2 warning signs in our investment analysis , you should know about...
When all is said and done, sometimes its easier to focus on companies that don't even need debt. Readers can access a list of growth stocks with zero net debt 100% free, right now.
New: AI Stock Screener & Alerts
Our new AI Stock Screener scans the market every day to uncover opportunities.
• Dividend Powerhouses (3%+ Yield)
• Undervalued Small Caps with Insider Buying
• High growth Tech and AI Companies
Or build your own from over 50 metrics.
Have feedback on this article? Concerned about the content? Get in touch with us directly. Alternatively, email editorial-team (at) simplywallst.com.
This article by Simply Wall St is general in nature. We provide commentary based on historical data and analyst forecasts only using an unbiased methodology and our articles are not intended to be financial advice. It does not constitute a recommendation to buy or sell any stock, and does not take account of your objectives, or your financial situation. We aim to bring you long-term focused analysis driven by fundamental data. Note that our analysis may not factor in the latest price-sensitive company announcements or qualitative material. Simply Wall St has no position in any stocks mentioned.
Have feedback on this article? Concerned about the content? Get in touch with us directly. Alternatively, email editorial-team@simplywallst.com
About NasdaqGM:XNCR
Xencor
A clinical-stage biopharmaceutical company, focuses on the discovery and development of engineered monoclonal antibodies for the treatment of asthma and allergic diseases, autoimmune diseases, and cancer.
Excellent balance sheet and slightly overvalued.
Similar Companies
Market Insights

Advertisement
Community Narratives
MicroVision will explode future revenue by 380.37% with a vision towards success
Fair Value US$60|98.4% undervalued
TH
Community Contributor
The Indispensable Artery for a New North American Economy
Fair Value CA$132.87|0.6% undervalued
TI
Community Contributor
Recently Updated Narratives
MA


MarkoVT on COVER ·
Q3 Outlook modestly optimistic
Fair Value:JP¥1.65k2.0% overvalued
1 followerusers have followed this narrative
0 commentsusers have commented on this narrative
0 likesusers have liked this narrative
BL


BlackGoat on Alphabet ·
Alphabet: The Under-appreciated Compounder Hiding in Plain Sight
Fair Value:US$324.481.3% undervalued
76 followersusers have followed this narrative
3 commentsusers have commented on this narrative
1 likeusers have liked this narrative
BE


Bejgal on MINISO Group Holding ·
MINISO's fair value is projected at 26.69 with an anticipated PE ratio shift of 20x
Fair Value:US$26.6926.7% undervalued
46 followersusers have followed this narrative
3 commentsusers have commented on this narrative
0 likesusers have liked this narrative
Popular Narratives
OS

oscargarcia on Alphabet ·
The company that turned a verb into a global necessity and basically runs the modern internet, digital ads, smartphones, maps, and AI.
Fair Value:US$3405.9% undervalued
136 followersusers have followed this narrative
6 commentsusers have commented on this narrative
18 likesusers have liked this narrative
TH

TheWallstreetKing on MicroVision ·
MicroVision will explode future revenue by 380.37% with a vision towards success
Fair Value:US$6098.4% undervalued
90 followersusers have followed this narrative
10 commentsusers have commented on this narrative
18 likesusers have liked this narrative
AN


AnalystConsensusTarget on NVIDIA ·
NVDA: Expanding AI Demand Will Drive Major Data Center Investments Through 2026
Fair Value:US$232.7922.6% undervalued
928 followersusers have followed this narrative
6 commentsusers have commented on this narrative
22 likesusers have liked this narrative