Advertisement
- United States
- /
- Pharma
- /
- NasdaqGS:XERS
Has the Recent 166% Rally Left Xeris Biopharma Fully Priced in 2025?

Simply Wall St
Reviewed by Bailey Pemberton
If you’re watching Xeris Biopharma Holdings right now, you’re definitely not alone. It’s the sort of stock that sparks debate. Should you lock in gains, hold on for more, or steer clear as momentum cools? Over the past year, Xeris has delivered an eye-popping 187.8% return, and so far, 2024’s rally is even more dramatic with shares up 166.2% year-to-date. While last week’s dip of 0.3% barely raised eyebrows, the 12.6% jump over the last month has many investors paying close attention to every move.
What’s fueling all this action? Recent updates around the company’s product pipeline and positive regulatory developments have reinforced investor confidence, hinting at potential for further upside and a possible re-rating of risk. It is not every day you see a company transform so quickly in the market’s eyes. Just look at the three-year gain of 458.2% for more proof of how sentiment has shifted.
But here is where things get interesting: looking at our value scorecard, Xeris chalks up a 3 out of 6, suggesting there are a few areas where it still appears undervalued. That is a sign there may be more than just hype behind the recent moves.
So, is Xeris Biopharma really as undervalued as the numbers suggest, or does the market already have it about right? Let’s walk through the main valuation checks, and stick around, because there might be an even sharper way to judge its true worth at the end.
Approach 1: Xeris Biopharma Holdings Discounted Cash Flow (DCF) Analysis
The Discounted Cash Flow (DCF) model works by estimating a company’s future cash flows and then discounting those amounts back to today’s dollars to determine what the business is really worth right now. For Xeris Biopharma Holdings, the approach uses detailed projections of Free Cash Flow (FCF) to gauge its intrinsic value.
In the most recent twelve months, Xeris reported Free Cash Flow of -$17.8 million. Analyst estimates forecast a strong turnaround in the years ahead, with FCF projected to reach $138.7 million by the end of 2029. The trajectory shows steadily accelerating growth: from $37.6 million in 2026, $60.2 million in 2027, and leaping higher each year, with much of the outer-year forecast extrapolated beyond direct analyst coverage.
Based on these projections and discounted to present value using a 2 Stage Free Cash Flow to Equity model, the estimated intrinsic value lands at $30.79 per share. This implies a substantial 70.1% discount compared to the current share price, suggesting that, under these DCF assumptions, Xeris Biopharma may be significantly undervalued by the market at this time.
Result: UNDERVALUED
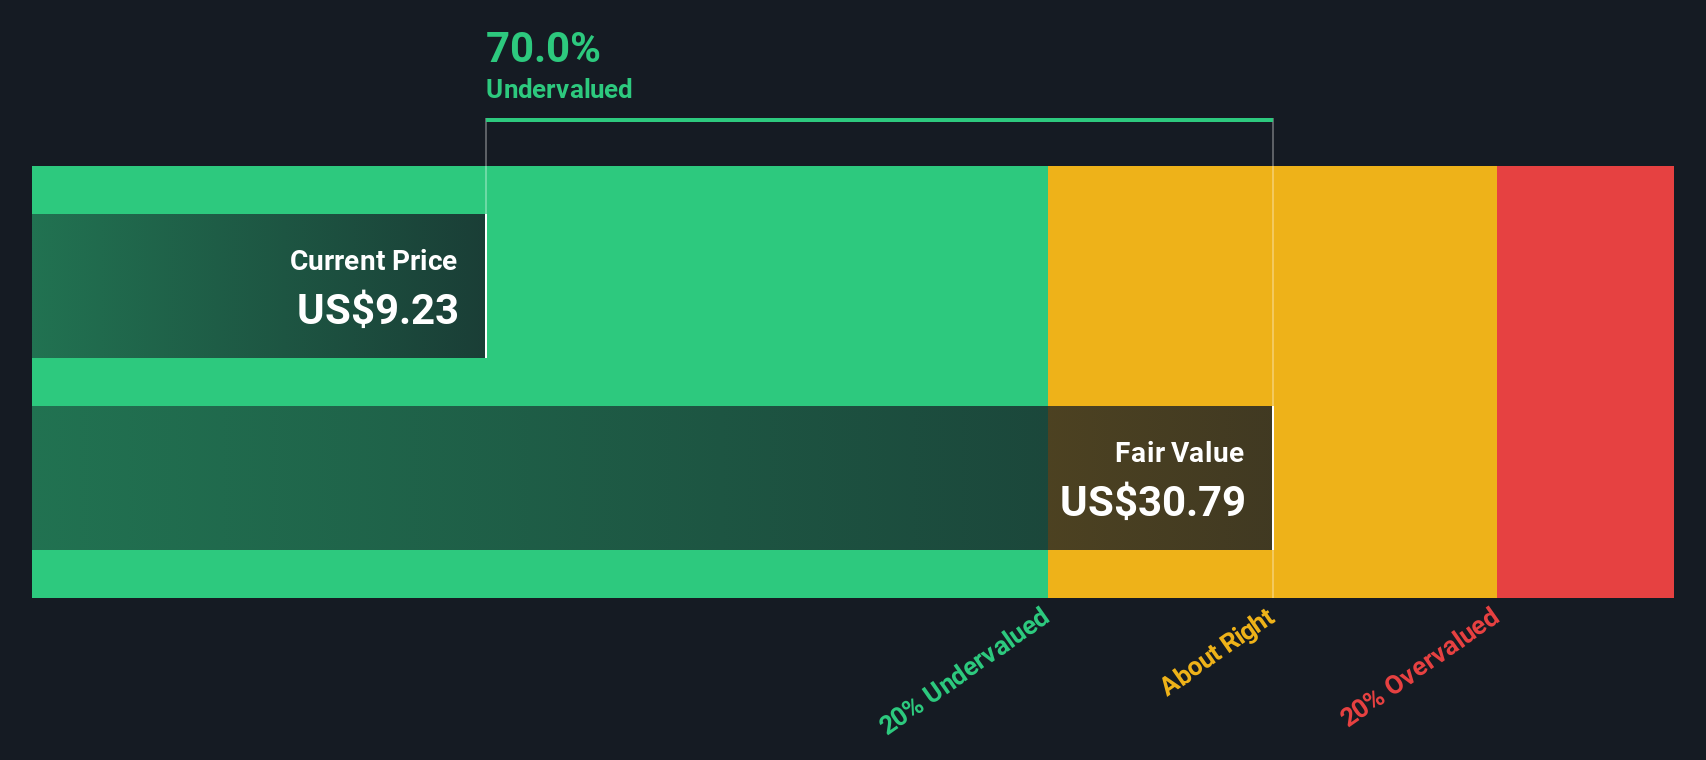
Our Discounted Cash Flow (DCF) analysis suggests Xeris Biopharma Holdings is undervalued by 70.1%. Track this in your watchlist or portfolio, or discover more undervalued stocks.
Approach 2: Xeris Biopharma Holdings Price vs Sales
When valuing a company like Xeris Biopharma Holdings, the Price-to-Sales (P/S) multiple is often the go-to metric, especially for biopharmaceutical firms that may not yet report positive earnings but demonstrate clear revenue traction. The P/S multiple gives a sense of how much investors are willing to pay for a dollar of sales, which is particularly relevant for companies at Xeris’s stage of growth.
Typically, higher expected growth and lower risk justify paying a higher P/S ratio. On the other hand, companies facing uncertainty might warrant a lower figure. That is why just comparing raw multiples only paints part of the picture. A company breaking new ground with strong revenue growth may deserve a higher multiple than mature, slower-growth peers.
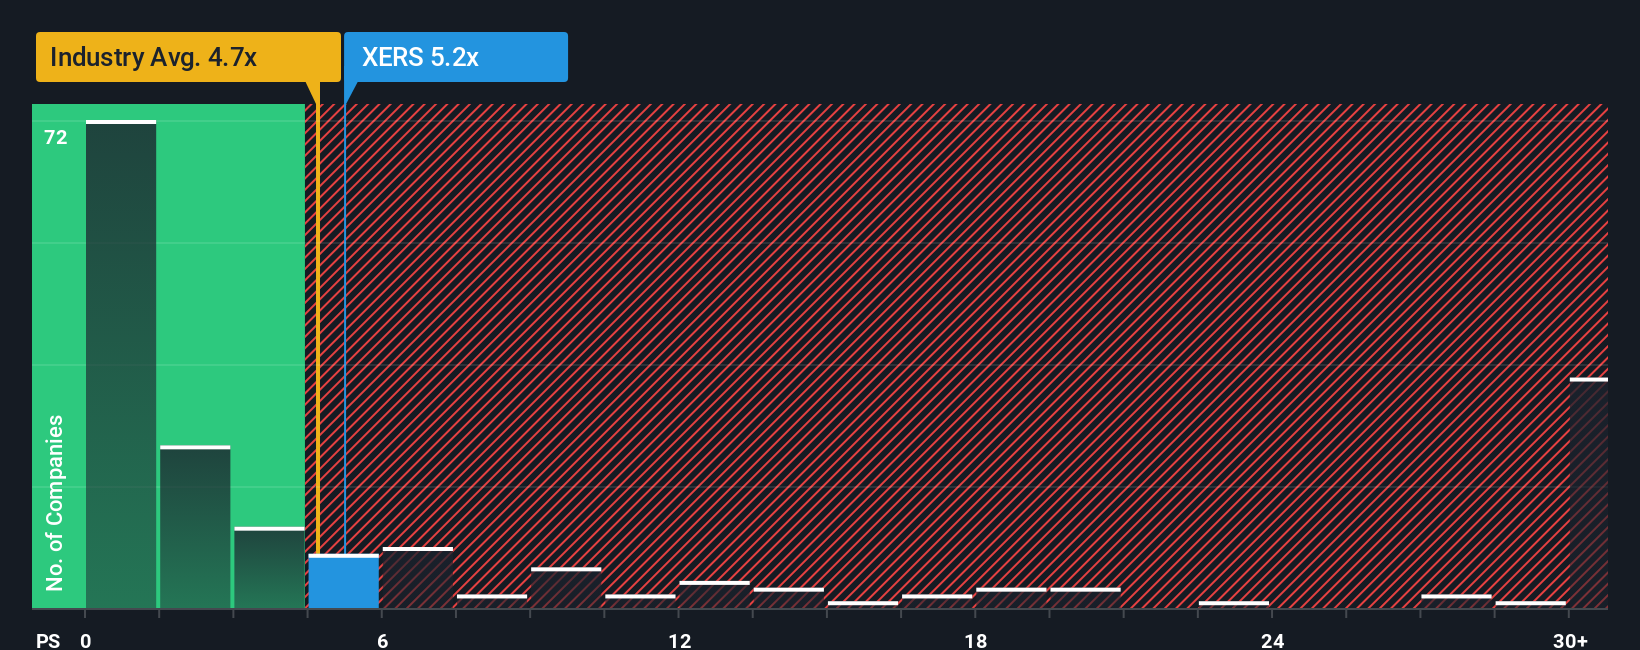
Xeris Biopharma’s current P/S ratio stands at 6.05x. By comparison, the industry average for Pharmaceuticals is 4.50x, while close peers average around 5.80x. At first glance, this puts Xeris slightly above the pack, possibly reflecting its anticipated growth trajectory and recent momentum.
Simply Wall St’s “Fair Ratio” digs deeper, combining not only sector and peer benchmarks but also growth rates, profit margins, risk factors, and Xeris’s market cap to provide a more tailored sense of fair value. For Xeris, the Fair Ratio computes to 6.09x, showing striking alignment with its current P/S multiple. Unlike traditional approaches that only use industry or peer averages, this Fair Ratio is holistic and tailored, honing in on what investors should truly expect given all available data.
With such a close match, where Xeris is trading at 6.05x versus a fair value of 6.09x, the numbers suggest the current share price is well calibrated to fundamentals.
Result: ABOUT RIGHT
PS ratios tell one story, but what if the real opportunity lies elsewhere? Discover companies where insiders are betting big on explosive growth.
Upgrade Your Decision Making: Choose your Xeris Biopharma Holdings Narrative
Earlier we mentioned that there is an even better way to understand valuation, so let's introduce you to Narratives. Simply put, a Narrative is your personalized story about Xeris Biopharma Holdings. It is your view on where the business is headed, how its products and growth drivers might evolve, and what that means for financial forecasts like future revenue, earnings, and profit margins.
A Narrative links the company's unique story directly to your expectations for its future numbers. This approach lets you translate your insights into a calculated fair value. Narratives are easy to use and available right within the Simply Wall St Community page, a tool trusted by millions of investors to share and compare their investment perspectives.
With Narratives, you can quickly see if your estimated fair value is above or below the current share price, helping you decide whether to buy, sell, or hold. They are continuously updated as new information, such as earnings or headline news, emerges so your story always reflects the latest market realities.
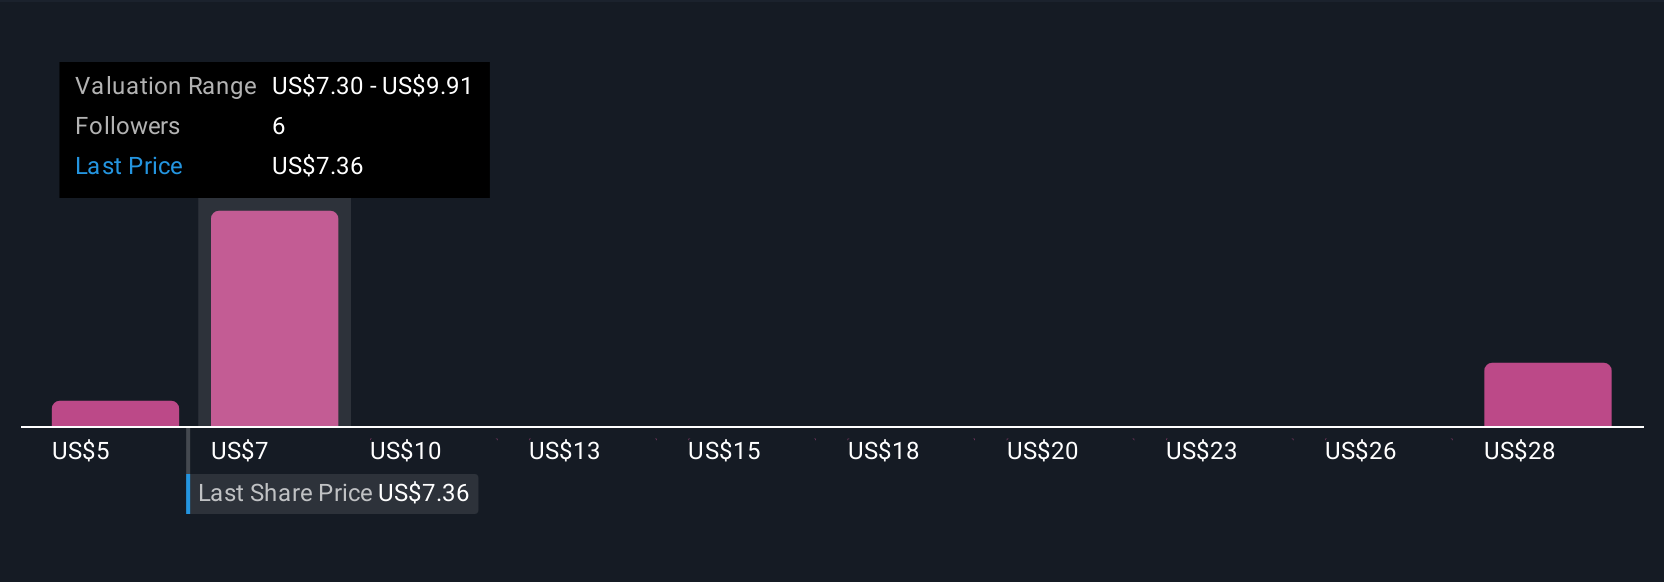
For example, one investor might believe in strong pipeline launches and project a fair value of $11.00 per share, while another emphasizes competitive risks and sees a lower value near $6.00. Narratives let you see and learn from this full spectrum of investor perspectives, making every decision informed, dynamic, and tailored to your own outlook.
Do you think there's more to the story for Xeris Biopharma Holdings? Create your own Narrative to let the Community know!
This article by Simply Wall St is general in nature. We provide commentary based on historical data and analyst forecasts only using an unbiased methodology and our articles are not intended to be financial advice. It does not constitute a recommendation to buy or sell any stock, and does not take account of your objectives, or your financial situation. We aim to bring you long-term focused analysis driven by fundamental data. Note that our analysis may not factor in the latest price-sensitive company announcements or qualitative material. Simply Wall St has no position in any stocks mentioned.
New: AI Stock Screener & Alerts
Our new AI Stock Screener scans the market every day to uncover opportunities.
• Dividend Powerhouses (3%+ Yield)
• Undervalued Small Caps with Insider Buying
• High growth Tech and AI Companies
Or build your own from over 50 metrics.
Have feedback on this article? Concerned about the content? Get in touch with us directly. Alternatively, email editorial-team@simplywallst.com
About NasdaqGS:XERS
Xeris Biopharma Holdings
A commercial-stage biopharmaceutical company, engages in developing and commercializing therapies for chronic endocrine and neurological diseases in Illinois.
Reasonable growth potential and fair value.
Market Insights

Advertisement
Community Narratives
Finding The True Value Of A Logistics Powerhouse
Fair Value US$95.21|8.4% undervalued
NV
Community Contributor
Paradigm Biopharmaceuticals Will Lead Osteoarthritis Treatment with Zilosul's FDA Success
Fair Value AU$5.50|92.1% undervalued
AM
Community Contributor
Barrick Mining (ABX:CA): A Gold Hedge against a U.S. Shutdown
Fair Value CA$60.00|24.2% undervalued
GM
Community Contributor