
Advertisement
- United States
- /
- Pharma
- /
- NasdaqGM:VRCA
With A 67% Price Drop For Verrica Pharmaceuticals Inc. (NASDAQ:VRCA) You'll Still Get What You Pay For

The Verrica Pharmaceuticals Inc. (NASDAQ:VRCA) share price has fared very poorly over the last month, falling by a substantial 67%. Instead of being rewarded, shareholders who have already held through the last twelve months are now sitting on a 37% share price drop.
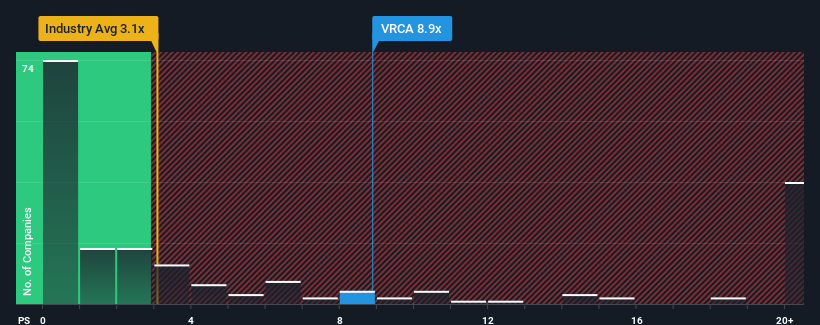
In spite of the heavy fall in price, Verrica Pharmaceuticals' price-to-sales (or "P/S") ratio of 8.9x might still make it look like a strong sell right now compared to other companies in the Pharmaceuticals industry in the United States, where around half of the companies have P/S ratios below 3.1x and even P/S below 0.8x are quite common. Nonetheless, we'd need to dig a little deeper to determine if there is a rational basis for the highly elevated P/S.
See our latest analysis for Verrica Pharmaceuticals
How Verrica Pharmaceuticals Has Been Performing
Recent times have been advantageous for Verrica Pharmaceuticals as its revenues have been rising faster than most other companies. It seems the market expects this form will continue into the future, hence the elevated P/S ratio. However, if this isn't the case, investors might get caught out paying too much for the stock.
Keen to find out how analysts think Verrica Pharmaceuticals' future stacks up against the industry? In that case, our free report is a great place to start.Do Revenue Forecasts Match The High P/S Ratio?
There's an inherent assumption that a company should far outperform the industry for P/S ratios like Verrica Pharmaceuticals' to be considered reasonable.
Retrospectively, the last year delivered an exceptional 62% gain to the company's top line. As a result, it also grew revenue by 16% in total over the last three years. So we can start by confirming that the company has actually done a good job of growing revenue over that time.
Looking ahead now, revenue is anticipated to climb by 130% each year during the coming three years according to the six analysts following the company. With the industry only predicted to deliver 16% each year, the company is positioned for a stronger revenue result.
With this in mind, it's not hard to understand why Verrica Pharmaceuticals' P/S is high relative to its industry peers. It seems most investors are expecting this strong future growth and are willing to pay more for the stock.
What Does Verrica Pharmaceuticals' P/S Mean For Investors?
Even after such a strong price drop, Verrica Pharmaceuticals' P/S still exceeds the industry median significantly. It's argued the price-to-sales ratio is an inferior measure of value within certain industries, but it can be a powerful business sentiment indicator.
We've established that Verrica Pharmaceuticals maintains its high P/S on the strength of its forecasted revenue growth being higher than the the rest of the Pharmaceuticals industry, as expected. It appears that shareholders are confident in the company's future revenues, which is propping up the P/S. Unless the analysts have really missed the mark, these strong revenue forecasts should keep the share price buoyant.
You need to take note of risks, for example - Verrica Pharmaceuticals has 4 warning signs (and 2 which shouldn't be ignored) we think you should know about.
Of course, profitable companies with a history of great earnings growth are generally safer bets. So you may wish to see this free collection of other companies that have reasonable P/E ratios and have grown earnings strongly.
New: Manage All Your Stock Portfolios in One Place
We've created the ultimate portfolio companion for stock investors, and it's free.
• Connect an unlimited number of Portfolios and see your total in one currency
• Be alerted to new Warning Signs or Risks via email or mobile
• Track the Fair Value of your stocks
Have feedback on this article? Concerned about the content? Get in touch with us directly. Alternatively, email editorial-team (at) simplywallst.com.
This article by Simply Wall St is general in nature. We provide commentary based on historical data and analyst forecasts only using an unbiased methodology and our articles are not intended to be financial advice. It does not constitute a recommendation to buy or sell any stock, and does not take account of your objectives, or your financial situation. We aim to bring you long-term focused analysis driven by fundamental data. Note that our analysis may not factor in the latest price-sensitive company announcements or qualitative material. Simply Wall St has no position in any stocks mentioned.
About NasdaqGM:VRCA
Verrica Pharmaceuticals
A clinical-stage dermatology therapeutics company, engages in the development and sales of medications for the treatment of skin diseases in the United States.
High growth potential moderate.
Similar Companies
Market Insights

Advertisement
Community Narratives
Groundbreaking therapies that could change the treatment landscape for PTSD, fibromyalgia, MS & Alzheimer’s
Fair Value US$6.20|86.9% undervalued
CM
Community Contributor
DigitalOcean Will Grow 14% by Embracing AI with Paperspace Acquisition
Fair Value US$50.00|42.8% undervalued
NE
Community Contributor
Viant Technology: A Rising AdTech Challenger in the AI-Powered CTV Market
Fair Value US$38.61|66.0% undervalued
BL
Community Contributor
Volvo will Accelerate Forward into Electric and Autonomous Leadership in Five Years
Fair Value SEK 438.80|40.8% undervalued
UN
Community Contributor