

Some say volatility, rather than debt, is the best way to think about risk as an investor, but Warren Buffett famously said that 'Volatility is far from synonymous with risk.' So it seems the smart money knows that debt - which is usually involved in bankruptcies - is a very important factor, when you assess how risky a company is. Importantly, TG Therapeutics, Inc. (NASDAQ:TGTX) does carry debt. But should shareholders be worried about its use of debt?
When Is Debt A Problem?
Debt and other liabilities become risky for a business when it cannot easily fulfill those obligations, either with free cash flow or by raising capital at an attractive price. Part and parcel of capitalism is the process of 'creative destruction' where failed businesses are mercilessly liquidated by their bankers. However, a more usual (but still expensive) situation is where a company must dilute shareholders at a cheap share price simply to get debt under control. Of course, plenty of companies use debt to fund growth, without any negative consequences. The first step when considering a company's debt levels is to consider its cash and debt together.
View our latest analysis for TG Therapeutics
What Is TG Therapeutics's Debt?
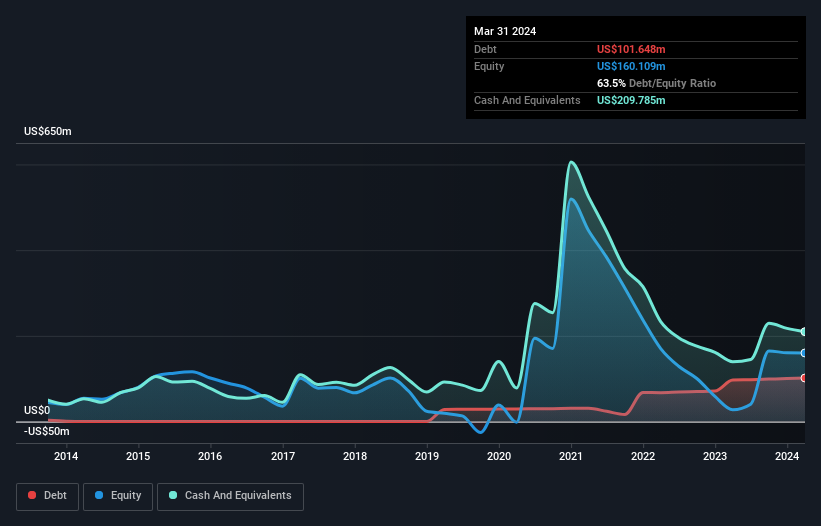
As you can see below, at the end of March 2024, TG Therapeutics had US$101.6m of debt, up from US$96.8m a year ago. Click the image for more detail. But it also has US$209.8m in cash to offset that, meaning it has US$108.1m net cash.
How Strong Is TG Therapeutics' Balance Sheet?
The latest balance sheet data shows that TG Therapeutics had liabilities of US$99.7m due within a year, and liabilities of US$113.5m falling due after that. Offsetting these obligations, it had cash of US$209.8m as well as receivables valued at US$65.0m due within 12 months. So it actually has US$61.6m more liquid assets than total liabilities.
This short term liquidity is a sign that TG Therapeutics could probably pay off its debt with ease, as its balance sheet is far from stretched. Succinctly put, TG Therapeutics boasts net cash, so it's fair to say it does not have a heavy debt load!
Notably, TG Therapeutics made a loss at the EBIT level, last year, but improved that to positive EBIT of US$48m in the last twelve months. When analysing debt levels, the balance sheet is the obvious place to start. But it is future earnings, more than anything, that will determine TG Therapeutics's ability to maintain a healthy balance sheet going forward. So if you want to see what the professionals think, you might find this free report on analyst profit forecasts to be interesting.
Finally, a company can only pay off debt with cold hard cash, not accounting profits. While TG Therapeutics has net cash on its balance sheet, it's still worth taking a look at its ability to convert earnings before interest and tax (EBIT) to free cash flow, to help us understand how quickly it is building (or eroding) that cash balance. Looking at the most recent year, TG Therapeutics recorded free cash flow of 42% of its EBIT, which is weaker than we'd expect. That weak cash conversion makes it more difficult to handle indebtedness.
Summing Up
While we empathize with investors who find debt concerning, you should keep in mind that TG Therapeutics has net cash of US$108.1m, as well as more liquid assets than liabilities. So we are not troubled with TG Therapeutics's debt use. There's no doubt that we learn most about debt from the balance sheet. However, not all investment risk resides within the balance sheet - far from it. For example - TG Therapeutics has 2 warning signs we think you should be aware of.
If you're interested in investing in businesses that can grow profits without the burden of debt, then check out this free list of growing businesses that have net cash on the balance sheet.
Valuation is complex, but we're here to simplify it.
Discover if TG Therapeutics might be undervalued or overvalued with our detailed analysis, featuring fair value estimates, potential risks, dividends, insider trades, and its financial condition.
Access Free AnalysisHave feedback on this article? Concerned about the content? Get in touch with us directly. Alternatively, email editorial-team (at) simplywallst.com.
This article by Simply Wall St is general in nature. We provide commentary based on historical data and analyst forecasts only using an unbiased methodology and our articles are not intended to be financial advice. It does not constitute a recommendation to buy or sell any stock, and does not take account of your objectives, or your financial situation. We aim to bring you long-term focused analysis driven by fundamental data. Note that our analysis may not factor in the latest price-sensitive company announcements or qualitative material. Simply Wall St has no position in any stocks mentioned.
Have feedback on this article? Concerned about the content? Get in touch with us directly. Alternatively, email editorial-team@simplywallst.com
About NasdaqCM:TGTX
TG Therapeutics
A commercial stage biopharmaceutical company, focuses on the acquisition, development, and commercialization of novel treatments for B-cell mediated diseases in the United States and internationally.
Exceptional growth potential with excellent balance sheet.

