
Advertisement
- United States
- /
- Pharma
- /
- NasdaqGS:PCRX
Pacira BioSciences, Inc.'s (NASDAQ:PCRX) Intrinsic Value Is Potentially 26% Below Its Share Price
Key Insights
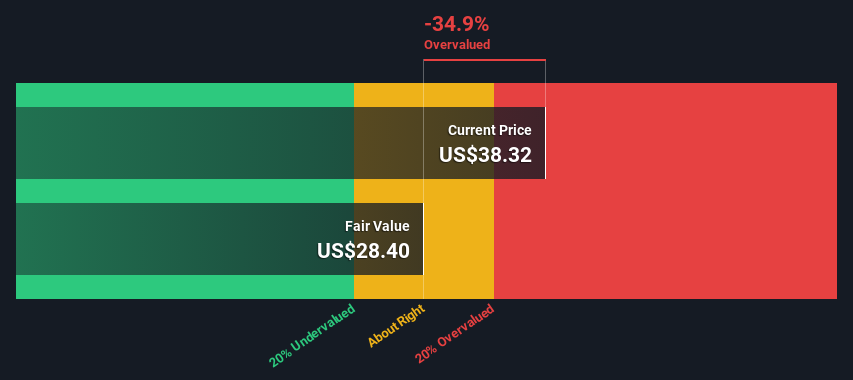
- Pacira BioSciences' estimated fair value is US$28.40 based on 2 Stage Free Cash Flow to Equity
- Current share price of US$38.32 suggests Pacira BioSciences is potentially 35% overvalued
- Analyst price target for PCRX is US$63.00, which is 122% above our fair value estimate
Today we'll do a simple run through of a valuation method used to estimate the attractiveness of Pacira BioSciences, Inc. (NASDAQ:PCRX) as an investment opportunity by taking the expected future cash flows and discounting them to their present value. We will take advantage of the Discounted Cash Flow (DCF) model for this purpose. Don't get put off by the jargon, the math behind it is actually quite straightforward.
We would caution that there are many ways of valuing a company and, like the DCF, each technique has advantages and disadvantages in certain scenarios. For those who are keen learners of equity analysis, the Simply Wall St analysis model here may be something of interest to you.
See our latest analysis for Pacira BioSciences
Step By Step Through The Calculation
We're using the 2-stage growth model, which simply means we take in account two stages of company's growth. In the initial period the company may have a higher growth rate and the second stage is usually assumed to have a stable growth rate. To start off with, we need to estimate the next ten years of cash flows. Seeing as no analyst estimates of free cash flow are available to us, we have extrapolate the previous free cash flow (FCF) from the company's last reported value. We assume companies with shrinking free cash flow will slow their rate of shrinkage, and that companies with growing free cash flow will see their growth rate slow, over this period. We do this to reflect that growth tends to slow more in the early years than it does in later years.
A DCF is all about the idea that a dollar in the future is less valuable than a dollar today, so we discount the value of these future cash flows to their estimated value in today's dollars:
10-year free cash flow (FCF) estimate
| 2024 | 2025 | 2026 | 2027 | 2028 | 2029 | 2030 | 2031 | 2032 | 2033 | |
| Levered FCF ($, Millions) | US$79.4m | US$74.1m | US$71.1m | US$69.5m | US$68.9m | US$68.9m | US$69.3m | US$70.1m | US$71.0m | US$72.2m |
| Growth Rate Estimate Source | Est @ -10.48% | Est @ -6.70% | Est @ -4.06% | Est @ -2.21% | Est @ -0.91% | Est @ -0.01% | Est @ 0.63% | Est @ 1.07% | Est @ 1.38% | Est @ 1.60% |
| Present Value ($, Millions) Discounted @ 6.9% | US$74.3 | US$64.9 | US$58.3 | US$53.3 | US$49.4 | US$46.3 | US$43.6 | US$41.2 | US$39.1 | US$37.2 |
("Est" = FCF growth rate estimated by Simply Wall St)
Present Value of 10-year Cash Flow (PVCF) = US$508m
The second stage is also known as Terminal Value, this is the business's cash flow after the first stage. For a number of reasons a very conservative growth rate is used that cannot exceed that of a country's GDP growth. In this case we have used the 5-year average of the 10-year government bond yield (2.1%) to estimate future growth. In the same way as with the 10-year 'growth' period, we discount future cash flows to today's value, using a cost of equity of 6.9%.
Terminal Value (TV)= FCF2033 × (1 + g) ÷ (r – g) = US$72m× (1 + 2.1%) ÷ (6.9%– 2.1%) = US$1.6b
Present Value of Terminal Value (PVTV)= TV / (1 + r)10= US$1.6b÷ ( 1 + 6.9%)10= US$799m
The total value, or equity value, is then the sum of the present value of the future cash flows, which in this case is US$1.3b. To get the intrinsic value per share, we divide this by the total number of shares outstanding. Compared to the current share price of US$38.3, the company appears potentially overvalued at the time of writing. The assumptions in any calculation have a big impact on the valuation, so it is better to view this as a rough estimate, not precise down to the last cent.
The Assumptions
Now the most important inputs to a discounted cash flow are the discount rate, and of course, the actual cash flows. If you don't agree with these result, have a go at the calculation yourself and play with the assumptions. The DCF also does not consider the possible cyclicality of an industry, or a company's future capital requirements, so it does not give a full picture of a company's potential performance. Given that we are looking at Pacira BioSciences as potential shareholders, the cost of equity is used as the discount rate, rather than the cost of capital (or weighted average cost of capital, WACC) which accounts for debt. In this calculation we've used 6.9%, which is based on a levered beta of 0.800. Beta is a measure of a stock's volatility, compared to the market as a whole. We get our beta from the industry average beta of globally comparable companies, with an imposed limit between 0.8 and 2.0, which is a reasonable range for a stable business.
SWOT Analysis for Pacira BioSciences
Strength
- Debt is well covered by cash flow.
Weakness
- Interest payments on debt are not well covered.
Opportunity
- Expected to breakeven next year.
- Has sufficient cash runway for more than 3 years based on current free cash flows.
- Good value based on P/S ratio compared to estimated Fair P/S ratio.
Threat
- No apparent threats visible for PCRX.
Next Steps:
Valuation is only one side of the coin in terms of building your investment thesis, and it ideally won't be the sole piece of analysis you scrutinize for a company. DCF models are not the be-all and end-all of investment valuation. Preferably you'd apply different cases and assumptions and see how they would impact the company's valuation. For instance, if the terminal value growth rate is adjusted slightly, it can dramatically alter the overall result. Can we work out why the company is trading at a premium to intrinsic value? For Pacira BioSciences, there are three important aspects you should explore:
- Risks: Consider for instance, the ever-present spectre of investment risk. We've identified 1 warning sign with Pacira BioSciences , and understanding it should be part of your investment process.
- Future Earnings: How does PCRX's growth rate compare to its peers and the wider market? Dig deeper into the analyst consensus number for the upcoming years by interacting with our free analyst growth expectation chart.
- Other High Quality Alternatives: Do you like a good all-rounder? Explore our interactive list of high quality stocks to get an idea of what else is out there you may be missing!
PS. Simply Wall St updates its DCF calculation for every American stock every day, so if you want to find the intrinsic value of any other stock just search here.
New: Manage All Your Stock Portfolios in One Place
We've created the ultimate portfolio companion for stock investors, and it's free.
• Connect an unlimited number of Portfolios and see your total in one currency
• Be alerted to new Warning Signs or Risks via email or mobile
• Track the Fair Value of your stocks
Have feedback on this article? Concerned about the content? Get in touch with us directly. Alternatively, email editorial-team (at) simplywallst.com.
This article by Simply Wall St is general in nature. We provide commentary based on historical data and analyst forecasts only using an unbiased methodology and our articles are not intended to be financial advice. It does not constitute a recommendation to buy or sell any stock, and does not take account of your objectives, or your financial situation. We aim to bring you long-term focused analysis driven by fundamental data. Note that our analysis may not factor in the latest price-sensitive company announcements or qualitative material. Simply Wall St has no position in any stocks mentioned.
About NasdaqGS:PCRX
Pacira BioSciences
Engages in the development, manufacture, marketing, distribution, and sale of non-opioid pain management and regenerative health solutions to healthcare practitioners in the United States.
Flawless balance sheet and undervalued.
Similar Companies
Market Insights

Advertisement
Community Narratives
The Next Phase of Energy Storage: How NeoVolta Is Tackling America’s Power Crunch
Fair Value US$7.50|35.1% undervalued
MA
Community Contributor
Why EnSilica is Worth Possibly 13x its Current Price
Fair Value UK£5.00|89.8% undervalued
DO
Community Contributor
M&A Activity, Industry Diversification & A Defense Contract Monopoly Will Push BWXT For Healthy Long-Term Growth
Fair Value US$220.00|15.2% undervalued
CL
Community Contributor
A case for Cassiar Gold Corp (TSXV: GLDC) to reach CAD$8-10 before 2030 (X30-37)
Fair Value CA$10.00|96.0% undervalued
AG
Community Contributor