- United States
- /
- Biotech
- /
- OTCPK:MTEM.Q
Lacklustre Performance Is Driving Molecular Templates, Inc.'s (NASDAQ:MTEM) 26% Price Drop
Unfortunately for some shareholders, the Molecular Templates, Inc. (NASDAQ:MTEM) share price has dived 26% in the last thirty days, prolonging recent pain. The drop over the last 30 days has capped off a tough year for shareholders, with the share price down 33% in that time.
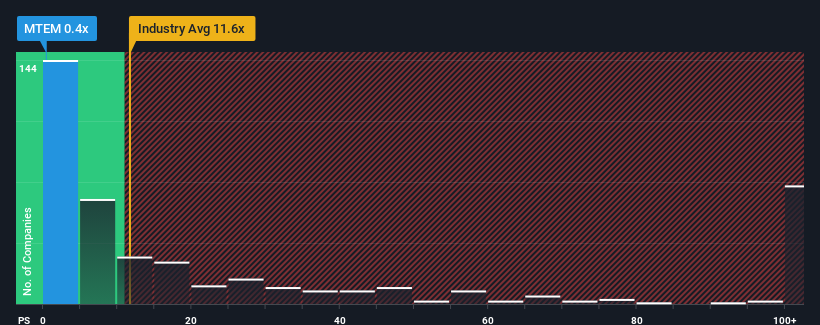
Since its price has dipped substantially, Molecular Templates may be sending very bullish signals at the moment with its price-to-sales (or "P/S") ratio of 0.4x, since almost half of all companies in the Biotechs industry in the United States have P/S ratios greater than 11.6x and even P/S higher than 49x are not unusual. Although, it's not wise to just take the P/S at face value as there may be an explanation why it's so limited.
View our latest analysis for Molecular Templates

What Does Molecular Templates' P/S Mean For Shareholders?
With revenue growth that's superior to most other companies of late, Molecular Templates has been doing relatively well. One possibility is that the P/S ratio is low because investors think this strong revenue performance might be less impressive moving forward. If the company manages to stay the course, then investors should be rewarded with a share price that matches its revenue figures.
If you'd like to see what analysts are forecasting going forward, you should check out our free report on Molecular Templates.Is There Any Revenue Growth Forecasted For Molecular Templates?
There's an inherent assumption that a company should far underperform the industry for P/S ratios like Molecular Templates' to be considered reasonable.
Taking a look back first, we see that the company grew revenue by an impressive 51% last year. The strong recent performance means it was also able to grow revenue by 146% in total over the last three years. So we can start by confirming that the company has done a great job of growing revenue over that time.
Looking ahead now, revenue is anticipated to slump, contracting by 46% per year during the coming three years according to the dual analysts following the company. Meanwhile, the broader industry is forecast to expand by 235% per annum, which paints a poor picture.
With this in consideration, we find it intriguing that Molecular Templates' P/S is closely matching its industry peers. Nonetheless, there's no guarantee the P/S has reached a floor yet with revenue going in reverse. There's potential for the P/S to fall to even lower levels if the company doesn't improve its top-line growth.
The Key Takeaway
Molecular Templates' P/S looks about as weak as its stock price lately. We'd say the price-to-sales ratio's power isn't primarily as a valuation instrument but rather to gauge current investor sentiment and future expectations.
As we suspected, our examination of Molecular Templates' analyst forecasts revealed that its outlook for shrinking revenue is contributing to its low P/S. At this stage investors feel the potential for an improvement in revenue isn't great enough to justify a higher P/S ratio. Unless there's material change, it's hard to envision a situation where the stock price will rise drastically.
Plus, you should also learn about these 5 warning signs we've spotted with Molecular Templates (including 2 which are concerning).
If strong companies turning a profit tickle your fancy, then you'll want to check out this free list of interesting companies that trade on a low P/E (but have proven they can grow earnings).
New: Manage All Your Stock Portfolios in One Place
We've created the ultimate portfolio companion for stock investors, and it's free.
• Connect an unlimited number of Portfolios and see your total in one currency
• Be alerted to new Warning Signs or Risks via email or mobile
• Track the Fair Value of your stocks
Have feedback on this article? Concerned about the content? Get in touch with us directly. Alternatively, email editorial-team (at) simplywallst.com.
This article by Simply Wall St is general in nature. We provide commentary based on historical data and analyst forecasts only using an unbiased methodology and our articles are not intended to be financial advice. It does not constitute a recommendation to buy or sell any stock, and does not take account of your objectives, or your financial situation. We aim to bring you long-term focused analysis driven by fundamental data. Note that our analysis may not factor in the latest price-sensitive company announcements or qualitative material. Simply Wall St has no position in any stocks mentioned.
About OTCPK:MTEM.Q
Molecular Templates
A clinical stage biopharmaceutical company, focuses on the discovery and development of biologic therapeutics for the treatment of cancer and other serious diseases in the United States.
Adequate balance sheet low.
Market Insights
Community Narratives


Recently Updated Narratives

Astor Enerji will surge with a fair value of $140.43 in the next 3 years

Proximus: The State-Backed Backup Plan with 7% Gross Yield and 15% Currency Upside.


A case for for IMPACT Silver Corp (TSXV:IPT) to reach USD $4.52 (CAD $6.16) in 2026 (23 bagger in 1 year) and USD $5.76 (CAD $7.89) by 2030
Popular Narratives


MicroVision will explode future revenue by 380.37% with a vision towards success


NVDA: Expanding AI Demand Will Drive Major Data Center Investments Through 2026


