
Advertisement
David Iben put it well when he said, 'Volatility is not a risk we care about. What we care about is avoiding the permanent loss of capital.' So it seems the smart money knows that debt - which is usually involved in bankruptcies - is a very important factor, when you assess how risky a company is. Importantly, ICON Public Limited Company (NASDAQ:ICLR) does carry debt. But is this debt a concern to shareholders?
What Risk Does Debt Bring?
Debt is a tool to help businesses grow, but if a business is incapable of paying off its lenders, then it exists at their mercy. If things get really bad, the lenders can take control of the business. However, a more usual (but still expensive) situation is where a company must dilute shareholders at a cheap share price simply to get debt under control. Of course, the upside of debt is that it often represents cheap capital, especially when it replaces dilution in a company with the ability to reinvest at high rates of return. The first thing to do when considering how much debt a business uses is to look at its cash and debt together.
Check out our latest analysis for ICON
How Much Debt Does ICON Carry?
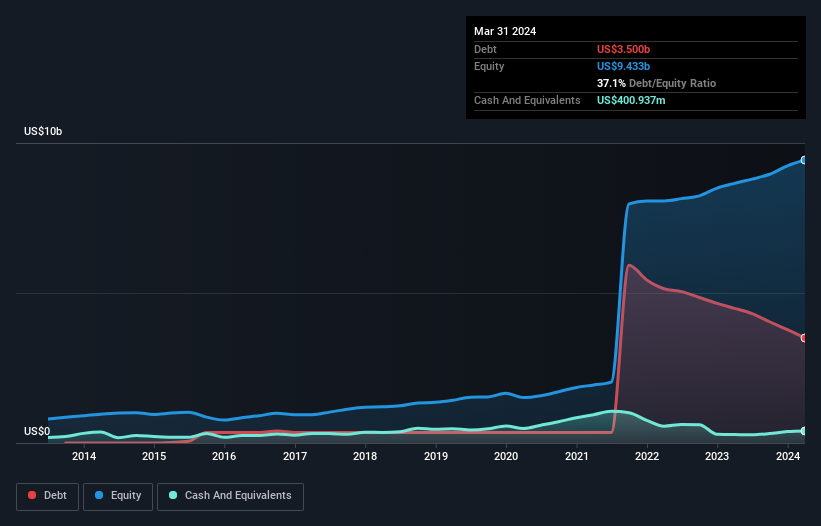
You can click the graphic below for the historical numbers, but it shows that ICON had US$3.50b of debt in March 2024, down from US$4.49b, one year before. However, it also had US$400.9m in cash, and so its net debt is US$3.10b.
How Strong Is ICON's Balance Sheet?
The latest balance sheet data shows that ICON had liabilities of US$2.95b due within a year, and liabilities of US$4.67b falling due after that. Offsetting these obligations, it had cash of US$400.9m as well as receivables valued at US$3.00b due within 12 months. So its liabilities outweigh the sum of its cash and (near-term) receivables by US$4.21b.
Given ICON has a humongous market capitalization of US$25.6b, it's hard to believe these liabilities pose much threat. However, we do think it is worth keeping an eye on its balance sheet strength, as it may change over time.
We use two main ratios to inform us about debt levels relative to earnings. The first is net debt divided by earnings before interest, tax, depreciation, and amortization (EBITDA), while the second is how many times its earnings before interest and tax (EBIT) covers its interest expense (or its interest cover, for short). The advantage of this approach is that we take into account both the absolute quantum of debt (with net debt to EBITDA) and the actual interest expenses associated with that debt (with its interest cover ratio).
ICON's net debt is sitting at a very reasonable 1.8 times its EBITDA, while its EBIT covered its interest expense just 3.5 times last year. While these numbers do not alarm us, it's worth noting that the cost of the company's debt is having a real impact. One way ICON could vanquish its debt would be if it stops borrowing more but continues to grow EBIT at around 20%, as it did over the last year. The balance sheet is clearly the area to focus on when you are analysing debt. But it is future earnings, more than anything, that will determine ICON's ability to maintain a healthy balance sheet going forward. So if you want to see what the professionals think, you might find this free report on analyst profit forecasts to be interesting.
Finally, a company can only pay off debt with cold hard cash, not accounting profits. So it's worth checking how much of that EBIT is backed by free cash flow. During the last three years, ICON generated free cash flow amounting to a very robust 91% of its EBIT, more than we'd expect. That positions it well to pay down debt if desirable to do so.
Our View
Happily, ICON's impressive conversion of EBIT to free cash flow implies it has the upper hand on its debt. But, on a more sombre note, we are a little concerned by its interest cover. When we consider the range of factors above, it looks like ICON is pretty sensible with its use of debt. That means they are taking on a bit more risk, in the hope of boosting shareholder returns. Over time, share prices tend to follow earnings per share, so if you're interested in ICON, you may well want to click here to check an interactive graph of its earnings per share history.
If you're interested in investing in businesses that can grow profits without the burden of debt, then check out this free list of growing businesses that have net cash on the balance sheet.
New: AI Stock Screener & Alerts
Our new AI Stock Screener scans the market every day to uncover opportunities.
• Dividend Powerhouses (3%+ Yield)
• Undervalued Small Caps with Insider Buying
• High growth Tech and AI Companies
Or build your own from over 50 metrics.
Have feedback on this article? Concerned about the content? Get in touch with us directly. Alternatively, email editorial-team (at) simplywallst.com.
This article by Simply Wall St is general in nature. We provide commentary based on historical data and analyst forecasts only using an unbiased methodology and our articles are not intended to be financial advice. It does not constitute a recommendation to buy or sell any stock, and does not take account of your objectives, or your financial situation. We aim to bring you long-term focused analysis driven by fundamental data. Note that our analysis may not factor in the latest price-sensitive company announcements or qualitative material. Simply Wall St has no position in any stocks mentioned.
About NasdaqGS:ICLR
ICON
A clinical research organization, provides outsourced development and commercialization services in Ireland, rest of Europe, the United States, and internationally.
Very undervalued with proven track record.
Similar Companies
Market Insights


Advertisement
Community Narratives
The Next Phase of Defense AI: A Robotic Response to America’s Security Gaps
Fair Value US$12.00|49.7% undervalued
MA
Community Contributor
Figma (FIG): The S&P 500’s Design Standard Turning Into an All-in-One Platform
Fair Value US$65.70|7.0% overvalued
TI
Community Contributor
Sleep Cycle's Revenue Set to Rise 10% with Strong Revenue Model
Fair Value SEK 38.04|22.5% undervalued
MA
Community Contributor
Has JB Hi-Fi Lost Its Point of Difference?
Fair Value AU$76.00|52.5% overvalued
RO
Community Contributor