- United States
- /
- Biotech
- /
- NasdaqCM:GTBP
We're Keeping An Eye On GT Biopharma's (NASDAQ:GTBP) Cash Burn Rate


Even when a business is losing money, it's possible for shareholders to make money if they buy a good business at the right price. For example, biotech and mining exploration companies often lose money for years before finding success with a new treatment or mineral discovery. But the harsh reality is that very many loss making companies burn through all their cash and go bankrupt.
So should GT Biopharma (NASDAQ:GTBP) shareholders be worried about its cash burn? In this article, we define cash burn as its annual (negative) free cash flow, which is the amount of money a company spends each year to fund its growth. First, we'll determine its cash runway by comparing its cash burn with its cash reserves.
Check out our latest analysis for GT Biopharma
Does GT Biopharma Have A Long Cash Runway?
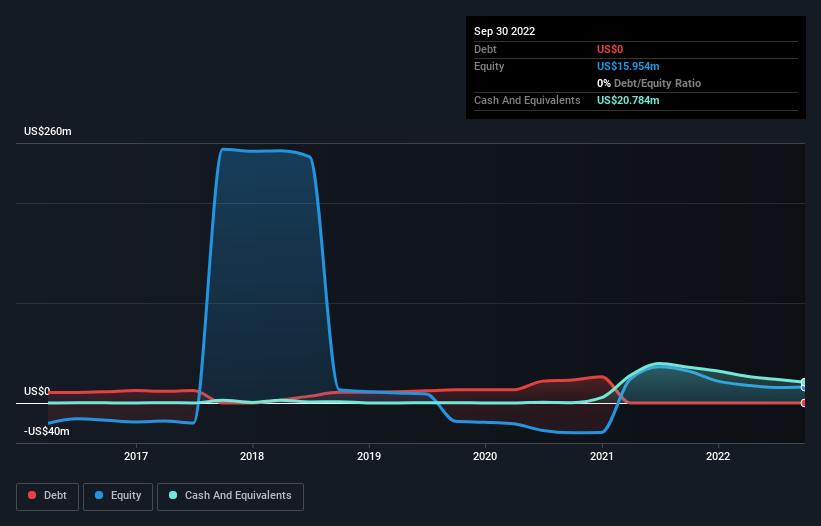
A company's cash runway is the amount of time it would take to burn through its cash reserves at its current cash burn rate. When GT Biopharma last reported its balance sheet in September 2022, it had zero debt and cash worth US$21m. Importantly, its cash burn was US$15m over the trailing twelve months. That means it had a cash runway of around 17 months as of September 2022. While that cash runway isn't too concerning, sensible holders would be peering into the distance, and considering what happens if the company runs out of cash. Depicted below, you can see how its cash holdings have changed over time.
How Is GT Biopharma's Cash Burn Changing Over Time?
Because GT Biopharma isn't currently generating revenue, we consider it an early-stage business. So while we can't look to sales to understand growth, we can look at how the cash burn is changing to understand how expenditure is trending over time. With the cash burn rate up 5.8% in the last year, it seems that the company is ratcheting up investment in the business over time. That's not necessarily a bad thing, but investors should be mindful of the fact that will shorten the cash runway. Clearly, however, the crucial factor is whether the company will grow its business going forward. So you might want to take a peek at how much the company is expected to grow in the next few years.
How Easily Can GT Biopharma Raise Cash?
Since its cash burn is increasing (albeit only slightly), GT Biopharma shareholders should still be mindful of the possibility it will require more cash in the future. Companies can raise capital through either debt or equity. Many companies end up issuing new shares to fund future growth. By looking at a company's cash burn relative to its market capitalisation, we gain insight on how much shareholders would be diluted if the company needed to raise enough cash to cover another year's cash burn.
Since it has a market capitalisation of US$34m, GT Biopharma's US$15m in cash burn equates to about 43% of its market value. From this perspective, it seems that the company spent a huge amount relative to its market value, and we'd be very wary of a painful capital raising.
So, Should We Worry About GT Biopharma's Cash Burn?
Even though its cash burn relative to its market cap makes us a little nervous, we are compelled to mention that we thought GT Biopharma's cash runway was relatively promising. Looking at the factors mentioned in this short report, we do think that its cash burn is a bit risky, and it does make us slightly nervous about the stock. Taking a deeper dive, we've spotted 6 warning signs for GT Biopharma you should be aware of, and 2 of them are significant.
If you would prefer to check out another company with better fundamentals, then do not miss this free list of interesting companies, that have HIGH return on equity and low debt or this list of stocks which are all forecast to grow.
If you're looking to trade GT Biopharma, open an account with the lowest-cost platform trusted by professionals, Interactive Brokers.
With clients in over 200 countries and territories, and access to 160 markets, IBKR lets you trade stocks, options, futures, forex, bonds and funds from a single integrated account.
Enjoy no hidden fees, no account minimums, and FX conversion rates as low as 0.03%, far better than what most brokers offer.
Sponsored ContentNew: Manage All Your Stock Portfolios in One Place
We've created the ultimate portfolio companion for stock investors, and it's free.
• Connect an unlimited number of Portfolios and see your total in one currency
• Be alerted to new Warning Signs or Risks via email or mobile
• Track the Fair Value of your stocks
Have feedback on this article? Concerned about the content? Get in touch with us directly. Alternatively, email editorial-team (at) simplywallst.com.
This article by Simply Wall St is general in nature. We provide commentary based on historical data and analyst forecasts only using an unbiased methodology and our articles are not intended to be financial advice. It does not constitute a recommendation to buy or sell any stock, and does not take account of your objectives, or your financial situation. We aim to bring you long-term focused analysis driven by fundamental data. Note that our analysis may not factor in the latest price-sensitive company announcements or qualitative material. Simply Wall St has no position in any stocks mentioned.
About NasdaqCM:GTBP
GT Biopharma
A clinical stage biopharmaceutical company, engages in the development and commercialization of immuno-oncology products based on its proprietary Tri-specific Killer Engager (TriKE) and Tetra-specific Killer Engager (Dual Targeting TriKE) fusion protein immune cell engager technology platforms.
Moderate with mediocre balance sheet.
Market Insights

Community Narratives

