CG Oncology (CGON) shares have been capturing attention lately, particularly given the swings seen over the past month. Investors seem curious about how these changes could reshape the company’s near-term prospects in the biotech sector.
After a strong 90-day share price return of 59.57% and a year-to-date climb of 41.56%, CG Oncology’s recent moves suggest that investor momentum is gathering pace. The 1-year total shareholder return of 24.67% highlights solid long-term progress, even with some short-term volatility.
If biotech’s momentum has you thinking bigger, now might be an ideal opportunity to discover other innovative healthcare stocks using our See the full list for free..
But with shares up sharply and recent gains reflecting positive growth numbers, the big question remains: is CG Oncology still undervalued, or has the market already factored in all of its future potential?
Advertisement
Price-to-Book Ratio of 4.7x: Is it Justified?
CG Oncology is trading at a price-to-book ratio of 4.7x, which gives important clues about how the market views its current value relative to its net assets. At yesterday’s close of $41.01, this figure places the company well above the industry average for US biotechs.
The price-to-book ratio compares a company’s market value to its book value, essentially showing how much investors are willing to pay for each dollar of net assets. In biotech, where many firms may not yet offer profits or consistent revenue, this metric can highlight market optimism or skepticism about a company's future pipeline and growth.
For CG Oncology, the 4.7x price-to-book ratio looks like a bargain compared to its peers, which average a striking 102.3x. However, when viewed against the broader US Biotechs industry average of just 2.5x, CG Oncology’s shares appear expensive. These contrasts highlight that the market is pricing in significant future growth expectations, but valuations can shift rapidly in high-growth, pre-revenue sectors.
However, slower-than-expected revenue growth or pipeline setbacks could quickly challenge the optimism that investors have priced into CG Oncology shares at current levels.
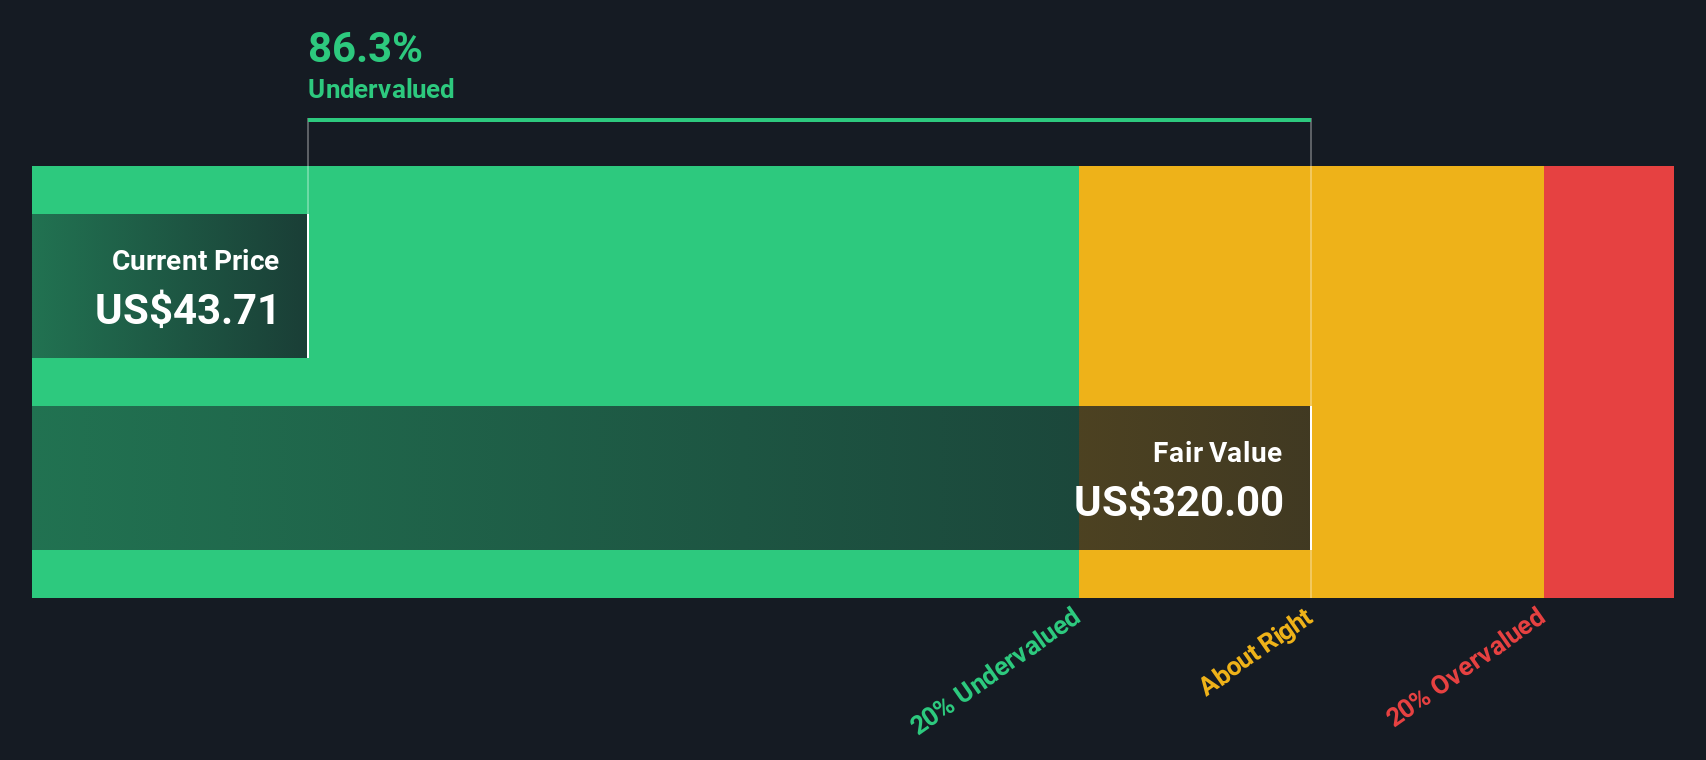
Another View: Discounted Cash Flow Indicates Deep Undervaluation
Looking at CG Oncology through the lens of our DCF model tells a very different story. The SWS DCF model calculates a fair value of $351.26 per share, more than eight times the current price. If this is accurate, could the market be missing CGON’s true potential, or is this optimism too far ahead of reality?
Simply Wall St performs a discounted cash flow (DCF) on every stock in the world every day (check out CG Oncology for example). We show the entire calculation in full. You can track the result in your watchlist or portfolio and be alerted when this changes, or use our stock screener to discover 878 undervalued stocks based on their cash flows. If you save a screener we even alert you when new companies match - so you never miss a potential opportunity.
Build Your Own CG Oncology Narrative
If you see the data differently or want to reach your own conclusions, you can easily build your own narrative in just a few minutes with Do it your way.
Why settle for one promising stock when there are countless others making waves right now? Let Simply Wall Street's tools show you where tomorrow’s opportunities begin.
Ride the next tech wave by scanning these 25 AI penny stocks to find companies at the forefront of artificial intelligence innovations.
This article by Simply Wall St is general in nature. We provide commentary based on historical data
and analyst forecasts only using an unbiased methodology and our articles are not intended to be financial advice. It does not constitute a recommendation to buy or sell any stock, and does not take account of your objectives, or your
financial situation. We aim to bring you long-term focused analysis driven by fundamental data.
Note that our analysis may not factor in the latest price-sensitive company announcements or qualitative material.
Simply Wall St has no position in any stocks mentioned.
New: AI Stock Screener & Alerts
Our new AI Stock Screener scans the market every day to uncover opportunities.
• Dividend Powerhouses (3%+ Yield) • Undervalued Small Caps with Insider Buying • High growth Tech and AI Companies