Advertisement
- South Korea
- /
- Semiconductors
- /
- KOSE:A000660
SK hynix And 2 More Stocks Estimated To Be Trading Below Fair Value

Simply Wall St
Reviewed by Simply Wall St

As global markets grapple with concerns over economic slowdowns and fluctuating indices, investors are increasingly seeking opportunities in undervalued stocks. In such volatile times, identifying companies trading below their fair value can offer a strategic advantage for long-term growth.
Top 10 Undervalued Stocks Based On Cash Flows
| Name | Current Price | Fair Value (Est) | Discount (Est) |
| Kaspi.kz (NasdaqGS:KSPI) | US$122.05 | US$243.53 | 49.9% |
| Ningxia Baofeng Energy Group (SHSE:600989) | CN¥14.40 | CN¥28.73 | 49.9% |
| Westgold Resources (ASX:WGX) | A$2.80 | A$5.60 | 50% |
| NSE (ENXTPA:ALNSE) | €29.30 | €58.25 | 49.7% |
| Litium (OM:LITI) | SEK8.22 | SEK16.43 | 50% |
| Ohara (TSE:5218) | ¥1304.00 | ¥2595.15 | 49.8% |
| Fluence Energy (NasdaqGS:FLNC) | US$21.09 | US$42.10 | 49.9% |
| Solstad Offshore (OB:SOFF) | NOK33.10 | NOK65.93 | 49.8% |
| Fine Foods & Pharmaceuticals N.T.M (BIT:FF) | €8.06 | €16.07 | 49.9% |
| Beijing Aosaikang Pharmaceutical (SZSE:002755) | CN¥10.93 | CN¥21.79 | 49.8% |
Underneath we present a selection of stocks filtered out by our screen.
SK hynix (KOSE:A000660)
Overview: SK hynix Inc., with a market cap of ₩108.25 trillion, manufactures, distributes, and sells semiconductor products across Korea, China, the rest of Asia, the United States, and Europe.
Operations: The company generates ₩49.22 billion from the manufacture and sale of semiconductor products across various regions, including Korea, China, the rest of Asia, the United States, and Europe.
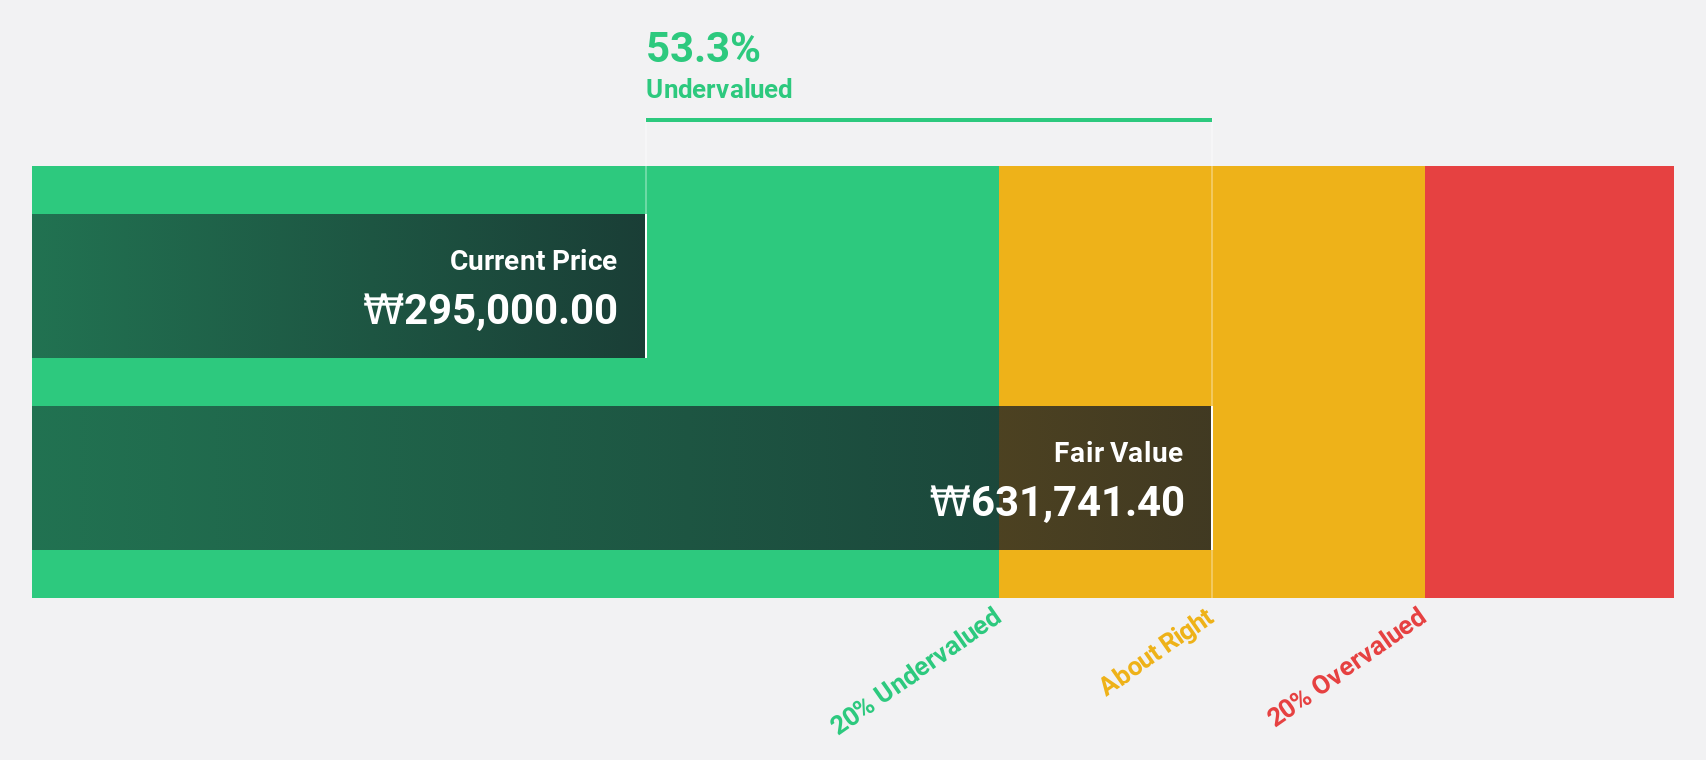
Estimated Discount To Fair Value: 16.3%
SK hynix appears undervalued based on discounted cash flow analysis, trading at ₩169,900, below the estimated fair value of ₩203,101.42. The company recently reported a significant turnaround with a net income of KRW 4.12 trillion for Q2 2024 and introduced industry-leading GDDR7 graphics memory and PCB01 SSD products aimed at AI markets. Earnings are forecast to grow 49.22% annually over the next three years, outpacing the broader Korean market's growth rate.
- Our earnings growth report unveils the potential for significant increases in SK hynix's future results.
- Click to explore a detailed breakdown of our findings in SK hynix's balance sheet health report.
BeiGene (NasdaqGS:BGNE)
Overview: BeiGene, Ltd. is an oncology company focused on discovering and developing cancer treatments globally, with a market cap of $22.43 billion.
Operations: Pharmaceutical products generated $3.10 billion in revenue for the company.
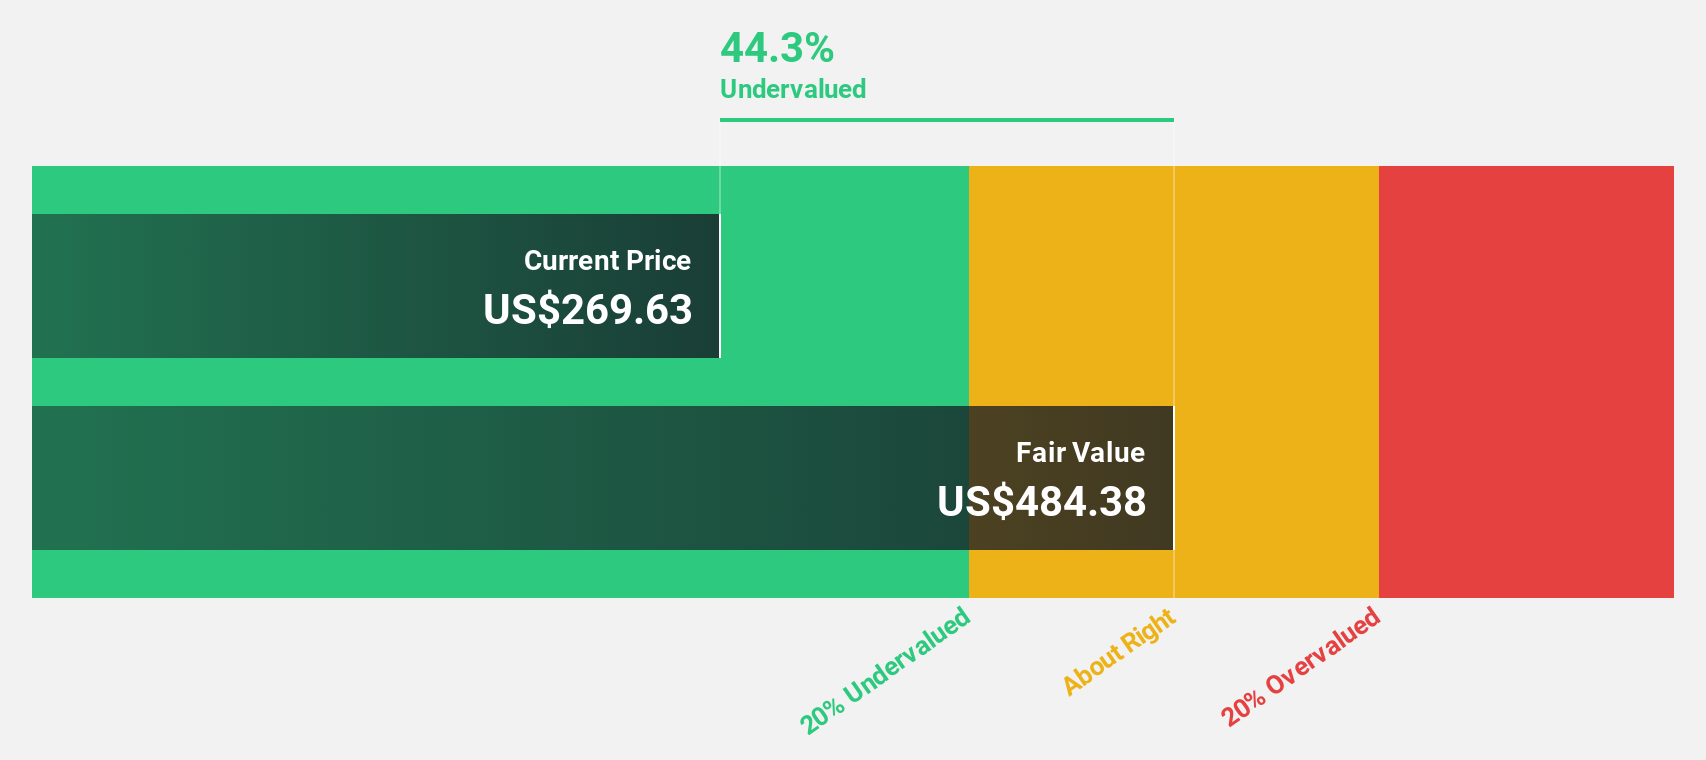
Estimated Discount To Fair Value: 20.8%
BeiGene appears undervalued based on discounted cash flow analysis, trading at US$211.15, below the estimated fair value of US$266.51. Recent earnings show revenue growth to US$929.17 million for Q2 2024, up from US$595.26 million a year ago, and a reduced net loss of US$120.41 million compared to US$381.14 million previously. The company is expected to become profitable within three years and has made significant investments in expanding its U.S.-based manufacturing capabilities.
- Insights from our recent growth report point to a promising forecast for BeiGene's business outlook.
- Take a closer look at BeiGene's balance sheet health here in our report.
Tokyo Electron (TSE:8035)
Overview: Tokyo Electron Limited, with a market cap of ¥10.23 trillion, develops, manufactures, and sells semiconductor and flat panel display production equipment globally.
Operations: The company's revenue from semiconductor production equipment is ¥1.99 billion.
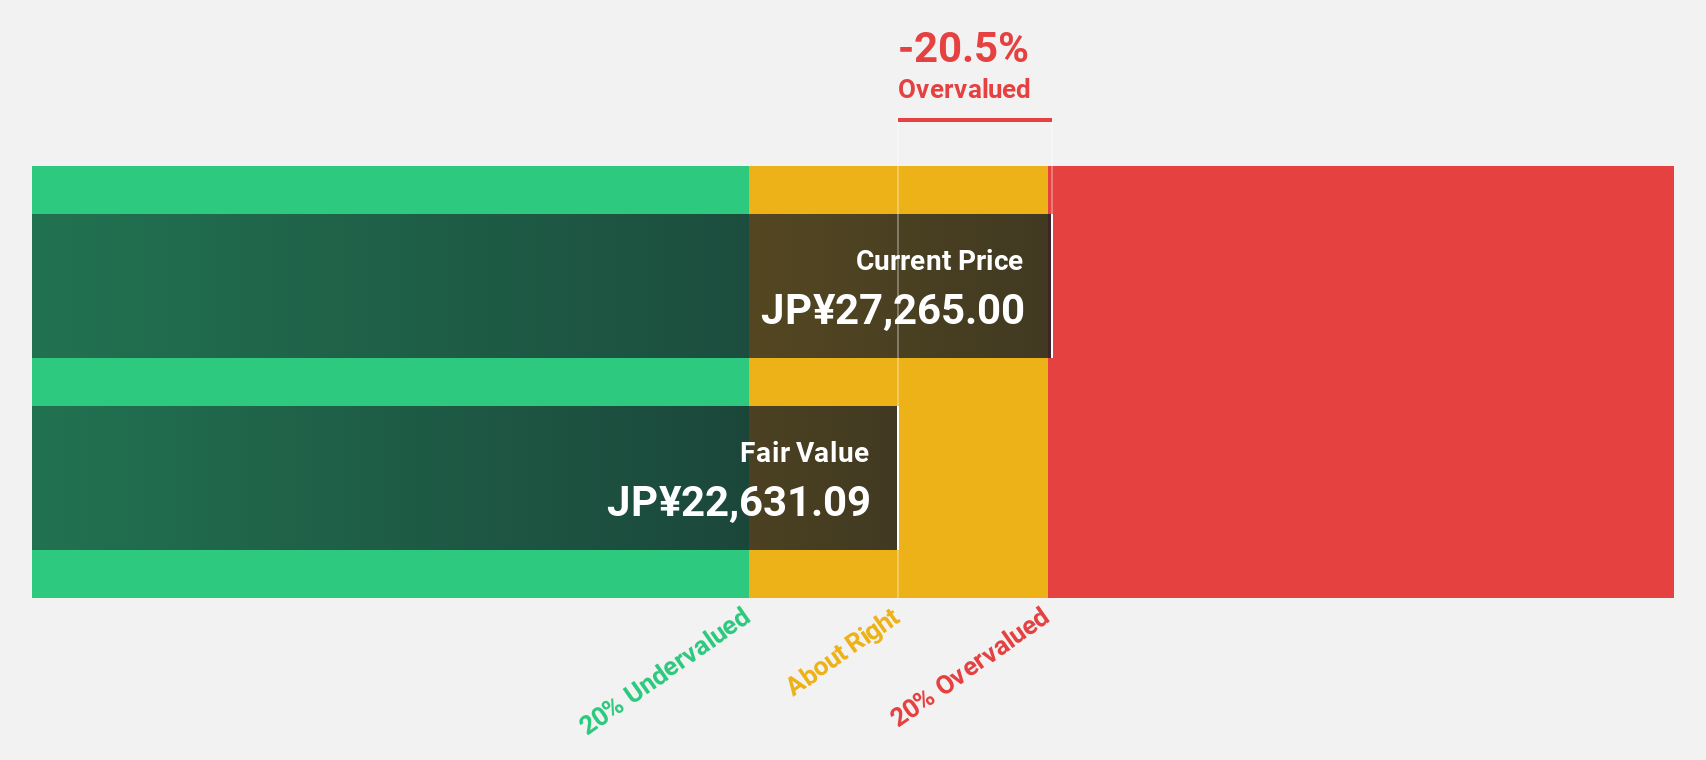
Estimated Discount To Fair Value: 11.4%
Tokyo Electron is trading at ¥23,280, below its estimated fair value of ¥26,264.90. The company recently raised its earnings guidance for the fiscal year ending March 31, 2025, with expected net sales of ¥2.3 trillion and operating income of ¥627 billion. Despite a volatile share price over the past three months, analysts forecast annual profit growth at 16.54%, outpacing the JP market's 8.6%. Additionally, Tokyo Electron has completed a significant share buyback worth approximately ¥80 billion.
- Our growth report here indicates Tokyo Electron may be poised for an improving outlook.
- Dive into the specifics of Tokyo Electron here with our thorough financial health report.
Turning Ideas Into Actions
- Embark on your investment journey to our 911 Undervalued Stocks Based On Cash Flows selection here.
- Are any of these part of your asset mix? Tap into the analytical power of Simply Wall St's portfolio to get a 360-degree view on how they're shaping up.
- Maximize your investment potential with Simply Wall St, the comprehensive app that offers global market insights for free.
Looking For Alternative Opportunities?
- Explore high-performing small cap companies that haven't yet garnered significant analyst attention.
- Diversify your portfolio with solid dividend payers offering reliable income streams to weather potential market turbulence.
- Fuel your portfolio with companies showing strong growth potential, backed by optimistic outlooks both from analysts and management.
This article by Simply Wall St is general in nature. We provide commentary based on historical data and analyst forecasts only using an unbiased methodology and our articles are not intended to be financial advice. It does not constitute a recommendation to buy or sell any stock, and does not take account of your objectives, or your financial situation. We aim to bring you long-term focused analysis driven by fundamental data. Note that our analysis may not factor in the latest price-sensitive company announcements or qualitative material. Simply Wall St has no position in any stocks mentioned.
New: Manage All Your Stock Portfolios in One Place
We've created the ultimate portfolio companion for stock investors, and it's free.
• Connect an unlimited number of Portfolios and see your total in one currency
• Be alerted to new Warning Signs or Risks via email or mobile
• Track the Fair Value of your stocks
Have feedback on this article? Concerned about the content? Get in touch with us directly. Alternatively, email editorial-team@simplywallst.com
About KOSE:A000660
SK hynix
Engages in the manufacture, distribution, and sale of semiconductor products in Korea, China, rest of Asia, the United States, and Europe.
Undervalued with excellent balance sheet.
Similar Companies
Market Insights


Advertisement
Community Narratives
MicroStrategy: Volatile Gamble or Golden Opportunity?
Fair Value US$663.00|33.3% undervalued
BL
Community Contributor
Emerging Markets and Debt Reduction Will Propel Bath & Body Works Forward
Fair Value US$40.73|23.4% undervalued
ZW
Community Contributor
An amazing opportunity to potentially get a 100 bagger
Fair Value US$10.00|8.5% overvalued
DA
Community Contributor