
Advertisement

We can readily understand why investors are attracted to unprofitable companies. For example, although software-as-a-service business Salesforce.com lost money for years while it grew recurring revenue, if you held shares since 2005, you'd have done very well indeed. Nonetheless, only a fool would ignore the risk that a loss making company burns through its cash too quickly.
So, the natural question for BioAtla (NASDAQ:BCAB) shareholders is whether they should be concerned by its rate of cash burn. For the purposes of this article, cash burn is the annual rate at which an unprofitable company spends cash to fund its growth; its negative free cash flow. First, we'll determine its cash runway by comparing its cash burn with its cash reserves.
View our latest analysis for BioAtla
Does BioAtla Have A Long Cash Runway?
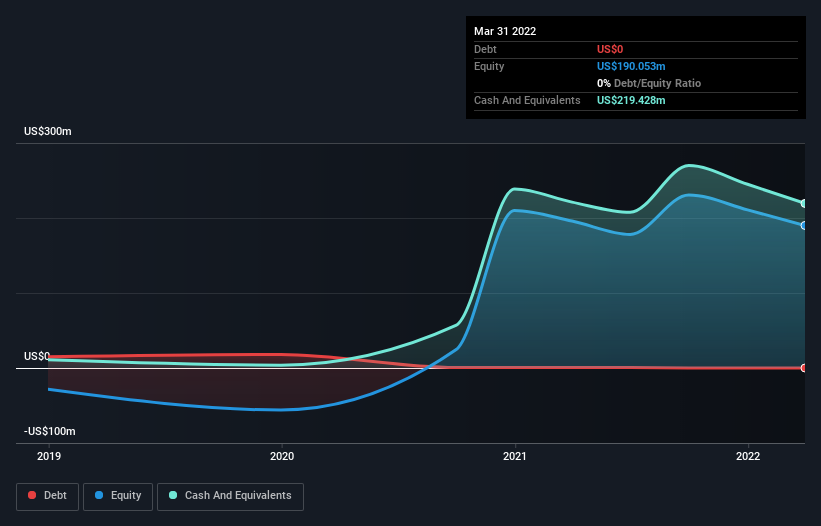
A company's cash runway is calculated by dividing its cash hoard by its cash burn. As at March 2022, BioAtla had cash of US$219m and no debt. In the last year, its cash burn was US$73m. Therefore, from March 2022 it had 3.0 years of cash runway. There's no doubt that this is a reassuringly long runway. You can see how its cash balance has changed over time in the image below.
How Is BioAtla's Cash Burn Changing Over Time?
Whilst it's great to see that BioAtla has already begun generating revenue from operations, last year it only produced US$250k, so we don't think it is generating significant revenue, at this point. Therefore, for the purposes of this analysis we'll focus on how the cash burn is tracking. With the cash burn rate up 50% in the last year, it seems that the company is ratcheting up investment in the business over time. However, the company's true cash runway will therefore be shorter than suggested above, if spending continues to increase. Clearly, however, the crucial factor is whether the company will grow its business going forward. So you might want to take a peek at how much the company is expected to grow in the next few years.
How Hard Would It Be For BioAtla To Raise More Cash For Growth?
Given its cash burn trajectory, BioAtla shareholders may wish to consider how easily it could raise more cash, despite its solid cash runway. Companies can raise capital through either debt or equity. Commonly, a business will sell new shares in itself to raise cash and drive growth. By looking at a company's cash burn relative to its market capitalisation, we gain insight on how much shareholders would be diluted if the company needed to raise enough cash to cover another year's cash burn.
BioAtla has a market capitalisation of US$88m and burnt through US$73m last year, which is 82% of the company's market value. That suggests the company may have some funding difficulties, and we'd be very wary of the stock.
Is BioAtla's Cash Burn A Worry?
On this analysis of BioAtla's cash burn, we think its cash runway was reassuring, while its cash burn relative to its market cap has us a bit worried. We don't think its cash burn is particularly problematic, but after considering the range of factors in this article, we do think shareholders should be monitoring how it changes over time. On another note, BioAtla has 6 warning signs (and 2 which don't sit too well with us) we think you should know about.
Of course, you might find a fantastic investment by looking elsewhere. So take a peek at this free list of interesting companies, and this list of stocks growth stocks (according to analyst forecasts)
Valuation is complex, but we're here to simplify it.
Discover if BioAtla might be undervalued or overvalued with our detailed analysis, featuring fair value estimates, potential risks, dividends, insider trades, and its financial condition.
Access Free AnalysisHave feedback on this article? Concerned about the content? Get in touch with us directly. Alternatively, email editorial-team (at) simplywallst.com.
This article by Simply Wall St is general in nature. We provide commentary based on historical data and analyst forecasts only using an unbiased methodology and our articles are not intended to be financial advice. It does not constitute a recommendation to buy or sell any stock, and does not take account of your objectives, or your financial situation. We aim to bring you long-term focused analysis driven by fundamental data. Note that our analysis may not factor in the latest price-sensitive company announcements or qualitative material. Simply Wall St has no position in any stocks mentioned.
About NasdaqGM:BCAB
BioAtla
A clinical-stage biopharmaceutical company, develops specific and selective antibody-based therapeutics for the treatment of solid tumor cancer.
Moderate with adequate balance sheet.
Market Insights

Advertisement
Community Narratives

BMW cruising ahead with new EVs and premium models to boost revenue 5%
Fair Value €135.07|44.6% undervalued
UN
Community Contributor
EU#2 - From Humble Beginnings to Global Powerhouse
Fair Value DKK 851.04|46.1% undervalued
TO
Community Contributor