- United States
- /
- Life Sciences
- /
- NasdaqCM:BNBX
The Market Doesn't Like What It Sees From Applied DNA Sciences, Inc.'s (NASDAQ:APDN) Revenues Yet As Shares Tumble 26%
To the annoyance of some shareholders, Applied DNA Sciences, Inc. (NASDAQ:APDN) shares are down a considerable 26% in the last month, which continues a horrid run for the company. For any long-term shareholders, the last month ends a year to forget by locking in a 52% share price decline.
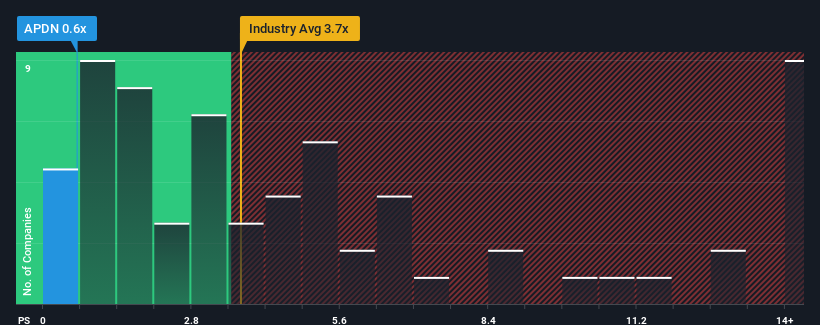
Following the heavy fall in price, Applied DNA Sciences' price-to-sales (or "P/S") ratio of 0.6x might make it look like a strong buy right now compared to the wider Life Sciences industry in the United States, where around half of the companies have P/S ratios above 3.7x and even P/S above 7x are quite common. Nonetheless, we'd need to dig a little deeper to determine if there is a rational basis for the highly reduced P/S.
See our latest analysis for Applied DNA Sciences

How Has Applied DNA Sciences Performed Recently?
Applied DNA Sciences has been struggling lately as its revenue has declined faster than most other companies. The P/S ratio is probably low because investors think this poor revenue performance isn't going to improve at all. If you still like the company, you'd want its revenue trajectory to turn around before making any decisions. Or at the very least, you'd be hoping the revenue slide doesn't get any worse if your plan is to pick up some stock while it's out of favour.
If you'd like to see what analysts are forecasting going forward, you should check out our free report on Applied DNA Sciences.What Are Revenue Growth Metrics Telling Us About The Low P/S?
There's an inherent assumption that a company should far underperform the industry for P/S ratios like Applied DNA Sciences' to be considered reasonable.
In reviewing the last year of financials, we were disheartened to see the company's revenues fell to the tune of 26%. Spectacularly, three year revenue growth has ballooned by several orders of magnitude, despite the drawbacks experienced in the last 12 months. So while the company has done a great job in the past, it's somewhat concerning to see revenue growth decline so harshly.
Looking ahead now, revenue is anticipated to plummet, contracting by 60% during the coming year according to the dual analysts following the company. With the rest of the industry predicted to shrink by 2.1%, it's a sub-optimal result.
With this in consideration, it's clear to us why Applied DNA Sciences' P/S isn't quite up to scratch with its industry peers. Nonetheless, with revenue going quickly in reverse, it's not guaranteed that the P/S has found a floor yet. Even just maintaining these prices could be difficult to achieve as the weak outlook is already weighing down the shares heavily.
The Key Takeaway
Applied DNA Sciences' P/S looks about as weak as its stock price lately. Typically, we'd caution against reading too much into price-to-sales ratios when settling on investment decisions, though it can reveal plenty about what other market participants think about the company.
As we suspected, our examination of Applied DNA Sciences' analyst forecasts revealed that its even shakier outlook against the industry is contributing factor to why its P/S is so low. With such a gloomy outlook, investors feel the potential for an improvement in revenue isn't great enough to justify paying a premium resulting in a higher P/S ratio. Typically when industry conditions are tough, there's a real risk of company revenues sliding further, which is a concern of ours in this case. Given the current circumstances, it's difficult to envision any significant increase in the share price in the near term.
Before you settle on your opinion, we've discovered 5 warning signs for Applied DNA Sciences (2 shouldn't be ignored!) that you should be aware of.
If you're unsure about the strength of Applied DNA Sciences' business, why not explore our interactive list of stocks with solid business fundamentals for some other companies you may have missed.
Valuation is complex, but we're here to simplify it.
Discover if BNB Plus might be undervalued or overvalued with our detailed analysis, featuring fair value estimates, potential risks, dividends, insider trades, and its financial condition.
Access Free AnalysisHave feedback on this article? Concerned about the content? Get in touch with us directly. Alternatively, email editorial-team (at) simplywallst.com.
This article by Simply Wall St is general in nature. We provide commentary based on historical data and analyst forecasts only using an unbiased methodology and our articles are not intended to be financial advice. It does not constitute a recommendation to buy or sell any stock, and does not take account of your objectives, or your financial situation. We aim to bring you long-term focused analysis driven by fundamental data. Note that our analysis may not factor in the latest price-sensitive company announcements or qualitative material. Simply Wall St has no position in any stocks mentioned.
About NasdaqCM:BNBX
Flawless balance sheet with moderate risk.
Similar Companies
Market Insights
Community Narratives


