
Advertisement
- United States
- /
- Pharma
- /
- NasdaqGS:ANTX
Here's Why We're Not Too Worried About AN2 Therapeutics' (NASDAQ:ANTX) Cash Burn Situation

Even when a business is losing money, it's possible for shareholders to make money if they buy a good business at the right price. For example, biotech and mining exploration companies often lose money for years before finding success with a new treatment or mineral discovery. But while history lauds those rare successes, those that fail are often forgotten; who remembers Pets.com?
So, the natural question for AN2 Therapeutics (NASDAQ:ANTX) shareholders is whether they should be concerned by its rate of cash burn. For the purpose of this article, we'll define cash burn as the amount of cash the company is spending each year to fund its growth (also called its negative free cash flow). First, we'll determine its cash runway by comparing its cash burn with its cash reserves.
See our latest analysis for AN2 Therapeutics
How Long Is AN2 Therapeutics' Cash Runway?
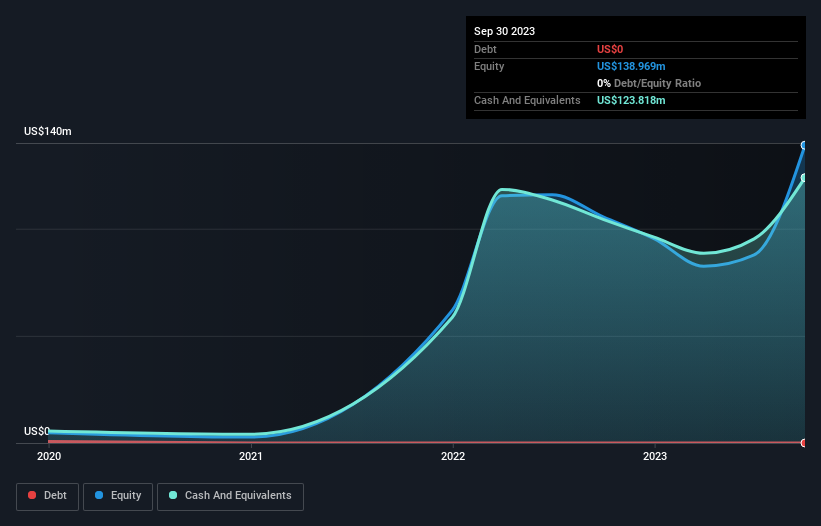
A company's cash runway is calculated by dividing its cash hoard by its cash burn. In September 2023, AN2 Therapeutics had US$124m in cash, and was debt-free. In the last year, its cash burn was US$44m. So it had a cash runway of about 2.8 years from September 2023. Arguably, that's a prudent and sensible length of runway to have. Depicted below, you can see how its cash holdings have changed over time.
How Is AN2 Therapeutics' Cash Burn Changing Over Time?
AN2 Therapeutics didn't record any revenue over the last year, indicating that it's an early stage company still developing its business. So while we can't look to sales to understand growth, we can look at how the cash burn is changing to understand how expenditure is trending over time. With the cash burn rate up 26% in the last year, it seems that the company is ratcheting up investment in the business over time. That's not necessarily a bad thing, but investors should be mindful of the fact that will shorten the cash runway. Clearly, however, the crucial factor is whether the company will grow its business going forward. For that reason, it makes a lot of sense to take a look at our analyst forecasts for the company.
How Hard Would It Be For AN2 Therapeutics To Raise More Cash For Growth?
Given its cash burn trajectory, AN2 Therapeutics shareholders may wish to consider how easily it could raise more cash, despite its solid cash runway. Issuing new shares, or taking on debt, are the most common ways for a listed company to raise more money for its business. Many companies end up issuing new shares to fund future growth. By comparing a company's annual cash burn to its total market capitalisation, we can estimate roughly how many shares it would have to issue in order to run the company for another year (at the same burn rate).
AN2 Therapeutics' cash burn of US$44m is about 44% of its US$99m market capitalisation. From this perspective, it seems that the company spent a huge amount relative to its market value, and we'd be very wary of a painful capital raising.
So, Should We Worry About AN2 Therapeutics' Cash Burn?
Even though its cash burn relative to its market cap makes us a little nervous, we are compelled to mention that we thought AN2 Therapeutics' cash runway was relatively promising. While we're the kind of investors who are always a bit concerned about the risks involved with cash burning companies, the metrics we have discussed in this article leave us relatively comfortable about AN2 Therapeutics' situation. Taking a deeper dive, we've spotted 6 warning signs for AN2 Therapeutics you should be aware of, and 3 of them are significant.
Of course AN2 Therapeutics may not be the best stock to buy. So you may wish to see this free collection of companies boasting high return on equity, or this list of stocks that insiders are buying.
New: Manage All Your Stock Portfolios in One Place
We've created the ultimate portfolio companion for stock investors, and it's free.
• Connect an unlimited number of Portfolios and see your total in one currency
• Be alerted to new Warning Signs or Risks via email or mobile
• Track the Fair Value of your stocks
Have feedback on this article? Concerned about the content? Get in touch with us directly. Alternatively, email editorial-team (at) simplywallst.com.
This article by Simply Wall St is general in nature. We provide commentary based on historical data and analyst forecasts only using an unbiased methodology and our articles are not intended to be financial advice. It does not constitute a recommendation to buy or sell any stock, and does not take account of your objectives, or your financial situation. We aim to bring you long-term focused analysis driven by fundamental data. Note that our analysis may not factor in the latest price-sensitive company announcements or qualitative material. Simply Wall St has no position in any stocks mentioned.
About NasdaqGS:ANTX
AN2 Therapeutics
A biopharmaceutical company, focuses on discovering and developing novel small molecule therapeutics.
Flawless balance sheet low.
Market Insights


Advertisement
Community Narratives
A case for TSXV:USA to reach USD $5.00 - $9.00 (CAD $7.30–$12.29) by 2029.
Fair Value CA$12.29|91.2% undervalued
AG
Community Contributor
DLocal's Future Growth Fueled by 35% Revenue and Profit Margin Boosts
Fair Value US$195.39|94.1% undervalued
WY
Community Contributor
Historically Cheap, but the Margin of Safety Is Still Thin
Fair Value SEK 232.58|12.7% undervalued
MA
Community Contributor