- United States
- /
- Biotech
- /
- NasdaqGS:ANIK
Is There An Opportunity With Anika Therapeutics, Inc.'s (NASDAQ:ANIK) 44% Undervaluation?


Key Insights
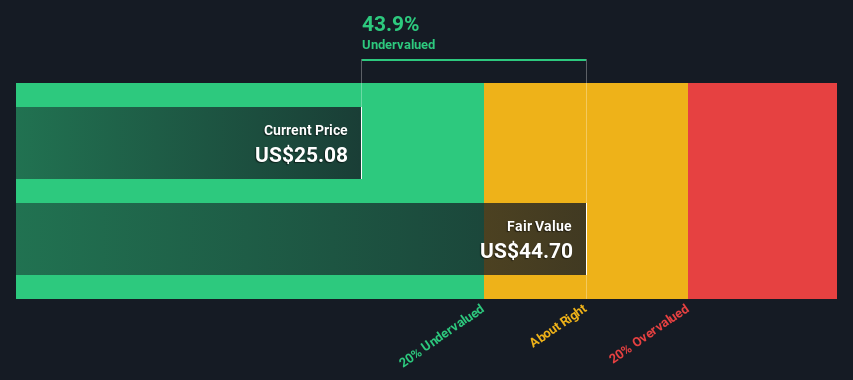
- Anika Therapeutics' estimated fair value is US$44.70 based on 2 Stage Free Cash Flow to Equity
- Anika Therapeutics' US$25.08 share price signals that it might be 44% undervalued
- Analyst price target for ANIK is US$27.67 which is 38% below our fair value estimate
Does the January share price for Anika Therapeutics, Inc. (NASDAQ:ANIK) reflect what it's really worth? Today, we will estimate the stock's intrinsic value by estimating the company's future cash flows and discounting them to their present value. The Discounted Cash Flow (DCF) model is the tool we will apply to do this. Don't get put off by the jargon, the math behind it is actually quite straightforward.
Companies can be valued in a lot of ways, so we would point out that a DCF is not perfect for every situation. Anyone interested in learning a bit more about intrinsic value should have a read of the Simply Wall St analysis model.
View our latest analysis for Anika Therapeutics
The Calculation
We are going to use a two-stage DCF model, which, as the name states, takes into account two stages of growth. The first stage is generally a higher growth period which levels off heading towards the terminal value, captured in the second 'steady growth' period. In the first stage we need to estimate the cash flows to the business over the next ten years. Where possible we use analyst estimates, but when these aren't available we extrapolate the previous free cash flow (FCF) from the last estimate or reported value. We assume companies with shrinking free cash flow will slow their rate of shrinkage, and that companies with growing free cash flow will see their growth rate slow, over this period. We do this to reflect that growth tends to slow more in the early years than it does in later years.
Generally we assume that a dollar today is more valuable than a dollar in the future, and so the sum of these future cash flows is then discounted to today's value:
10-year free cash flow (FCF) forecast
| 2024 | 2025 | 2026 | 2027 | 2028 | 2029 | 2030 | 2031 | 2032 | 2033 | |
| Levered FCF ($, Millions) | US$7.07m | US$12.0m | US$16.2m | US$20.1m | US$23.7m | US$26.9m | US$29.5m | US$31.8m | US$33.7m | US$35.3m |
| Growth Rate Estimate Source | Analyst x2 | Analyst x2 | Est @ 34.21% | Est @ 24.61% | Est @ 17.89% | Est @ 13.19% | Est @ 9.90% | Est @ 7.60% | Est @ 5.98% | Est @ 4.85% |
| Present Value ($, Millions) Discounted @ 6.2% | US$6.7 | US$10.7 | US$13.5 | US$15.8 | US$17.6 | US$18.7 | US$19.4 | US$19.6 | US$19.6 | US$19.3 |
("Est" = FCF growth rate estimated by Simply Wall St)
Present Value of 10-year Cash Flow (PVCF) = US$161m
We now need to calculate the Terminal Value, which accounts for all the future cash flows after this ten year period. The Gordon Growth formula is used to calculate Terminal Value at a future annual growth rate equal to the 5-year average of the 10-year government bond yield of 2.2%. We discount the terminal cash flows to today's value at a cost of equity of 6.2%.
Terminal Value (TV)= FCF2033 × (1 + g) ÷ (r – g) = US$35m× (1 + 2.2%) ÷ (6.2%– 2.2%) = US$903m
Present Value of Terminal Value (PVTV)= TV / (1 + r)10= US$903m÷ ( 1 + 6.2%)10= US$494m
The total value, or equity value, is then the sum of the present value of the future cash flows, which in this case is US$655m. In the final step we divide the equity value by the number of shares outstanding. Compared to the current share price of US$25.1, the company appears quite undervalued at a 44% discount to where the stock price trades currently. Valuations are imprecise instruments though, rather like a telescope - move a few degrees and end up in a different galaxy. Do keep this in mind.
The Assumptions
We would point out that the most important inputs to a discounted cash flow are the discount rate and of course the actual cash flows. If you don't agree with these result, have a go at the calculation yourself and play with the assumptions. The DCF also does not consider the possible cyclicality of an industry, or a company's future capital requirements, so it does not give a full picture of a company's potential performance. Given that we are looking at Anika Therapeutics as potential shareholders, the cost of equity is used as the discount rate, rather than the cost of capital (or weighted average cost of capital, WACC) which accounts for debt. In this calculation we've used 6.2%, which is based on a levered beta of 0.800. Beta is a measure of a stock's volatility, compared to the market as a whole. We get our beta from the industry average beta of globally comparable companies, with an imposed limit between 0.8 and 2.0, which is a reasonable range for a stable business.
Next Steps:
Valuation is only one side of the coin in terms of building your investment thesis, and it ideally won't be the sole piece of analysis you scrutinize for a company. It's not possible to obtain a foolproof valuation with a DCF model. Rather it should be seen as a guide to "what assumptions need to be true for this stock to be under/overvalued?" If a company grows at a different rate, or if its cost of equity or risk free rate changes sharply, the output can look very different. Why is the intrinsic value higher than the current share price? For Anika Therapeutics, there are three fundamental factors you should assess:
- Financial Health: Does ANIK have a healthy balance sheet? Take a look at our free balance sheet analysis with six simple checks on key factors like leverage and risk.
- Future Earnings: How does ANIK's growth rate compare to its peers and the wider market? Dig deeper into the analyst consensus number for the upcoming years by interacting with our free analyst growth expectation chart.
- Other Solid Businesses: Low debt, high returns on equity and good past performance are fundamental to a strong business. Why not explore our interactive list of stocks with solid business fundamentals to see if there are other companies you may not have considered!
PS. The Simply Wall St app conducts a discounted cash flow valuation for every stock on the NASDAQGS every day. If you want to find the calculation for other stocks just search here.
New: Manage All Your Stock Portfolios in One Place
We've created the ultimate portfolio companion for stock investors, and it's free.
• Connect an unlimited number of Portfolios and see your total in one currency
• Be alerted to new Warning Signs or Risks via email or mobile
• Track the Fair Value of your stocks
Have feedback on this article? Concerned about the content? Get in touch with us directly. Alternatively, email editorial-team (at) simplywallst.com.
This article by Simply Wall St is general in nature. We provide commentary based on historical data and analyst forecasts only using an unbiased methodology and our articles are not intended to be financial advice. It does not constitute a recommendation to buy or sell any stock, and does not take account of your objectives, or your financial situation. We aim to bring you long-term focused analysis driven by fundamental data. Note that our analysis may not factor in the latest price-sensitive company announcements or qualitative material. Simply Wall St has no position in any stocks mentioned.
About NasdaqGS:ANIK
Anika Therapeutics
A joint preservation company, creates and delivers advancements in early intervention orthopedic care in the areas of osteoarthritis (OA) pain management, regenerative solutions, sports medicine, and arthrosurface joint solutions in the United States, Europe, and internationally.
Flawless balance sheet and fair value.
Similar Companies
Market Insights

Community Narratives

