Advertisement
- United States
- /
- Biotech
- /
- NasdaqGS:AMGN
How Does Amgen Stack Up After Humira Biosimilar Launch and Recent Price Swings?

Simply Wall St
Reviewed by Simply Wall St
Thinking about what to do with Amgen stock lately? You are not alone. With biotech making headlines and market sentiment shifting, a lot of investors are weighing their next move. Looking over the past year, Amgen has seen some ups and downs: the stock is down 1.4% this week, off 5.9% for the month, but still up a healthy 11.3% since January. If you zoom out even farther, its 3- and 5-year performances show gains of 32.6% and 33.2%, respectively, although it is off by 8.8% compared to this time last year. That mix of short-term volatility and longer-term growth is exactly what has people double-checking their assumptions.
Some of the recent movement is tied to sector-wide dynamics. With pharmaceutical stocks facing more regulatory scrutiny and shifts in Medicare drug pricing, risk perceptions for established players like Amgen have changed. At the same time, the company has continued to grow its drug pipeline and complete strategic deals, helping it stay in investor conversations as a steady, if sometimes unpredictable, performer.
So what does that mean for valuation? Here is the good news: by our set of six major valuation checks, Amgen scores a 4, indicating the stock is undervalued on four out of six key measures. Of course, valuation is never that simple. Next, we will dig into what those checks are, and, even better, introduce you to a way of thinking about value that most investors overlook.
Why Amgen is lagging behind its peersApproach 1: Amgen Cash Flows
A Discounted Cash Flow (DCF) model estimates what a business is worth by projecting its future cash flows and then discounting them back to today’s value. This essentially asks: If we know roughly how much cash Amgen will generate each year moving forward, how much is that worth right now?
For Amgen, the latest twelve months’ free cash flow stands at $10.7 billion. Analyst estimates show steady growth in free cash flow, projecting a jump from over $14.2 billion in 2026 to around $17.7 billion by 2035. While analyst forecasts only cover about five years, beyond that, the DCF uses Simply Wall St’s conservative growth assumptions to continue the projection through the next decade.
Based on these estimates, the DCF method calculates an intrinsic value per share of $606.91. Compared to the current share price, this represents Amgen trading 52.5% below its calculated value. In other words, if future results are similar to these projections, the market appears to be pricing Amgen stock well below its estimated worth.
Result: UNDERVALUED
Head to the Valuation section of our Company Report for more details on how we arrive at this Fair Value for Amgen.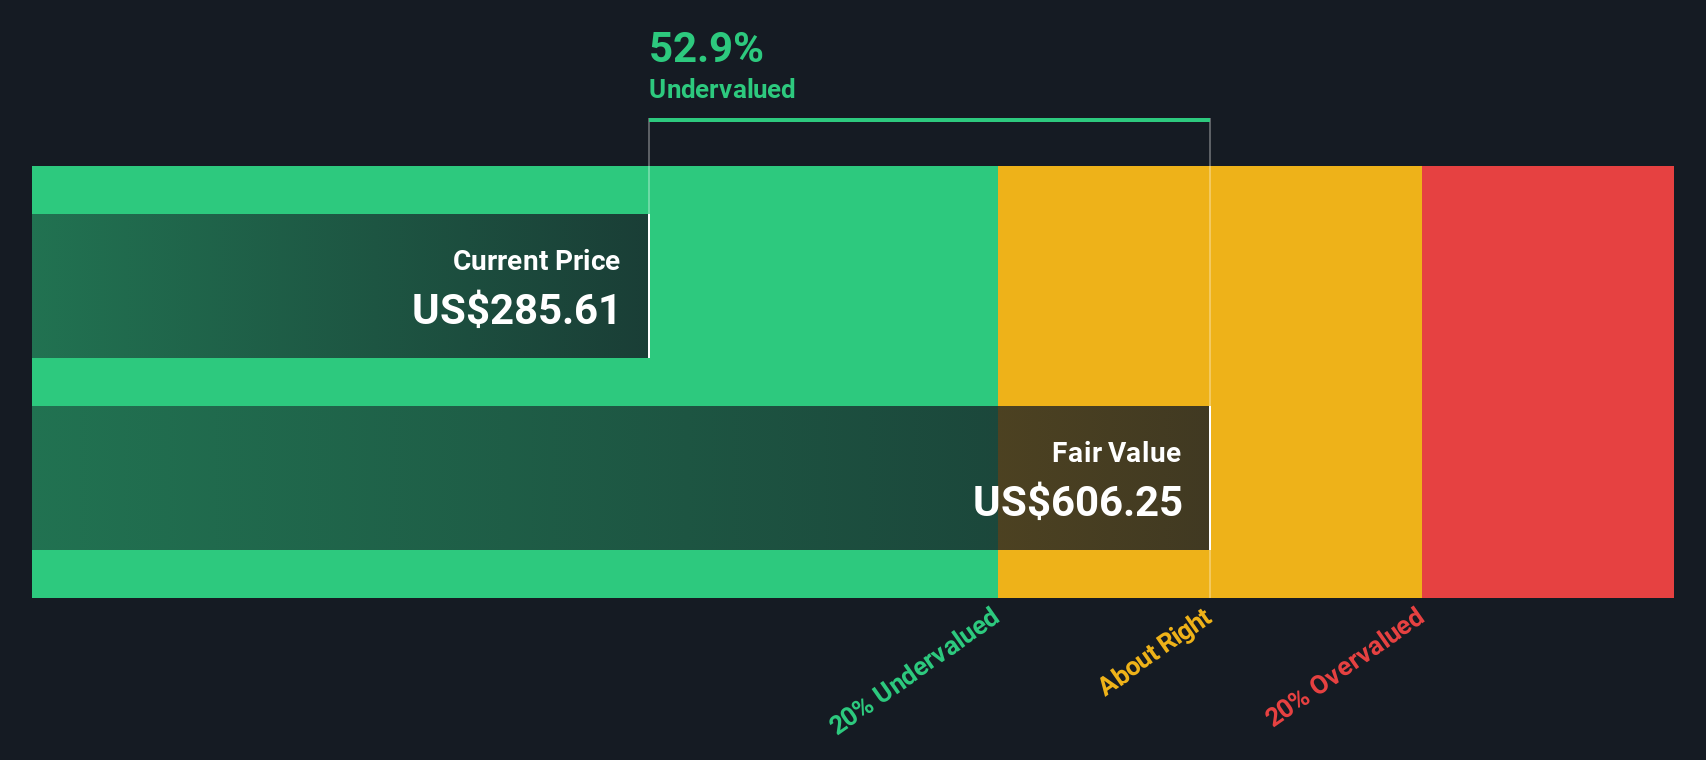
Approach 2: Amgen Price vs Earnings
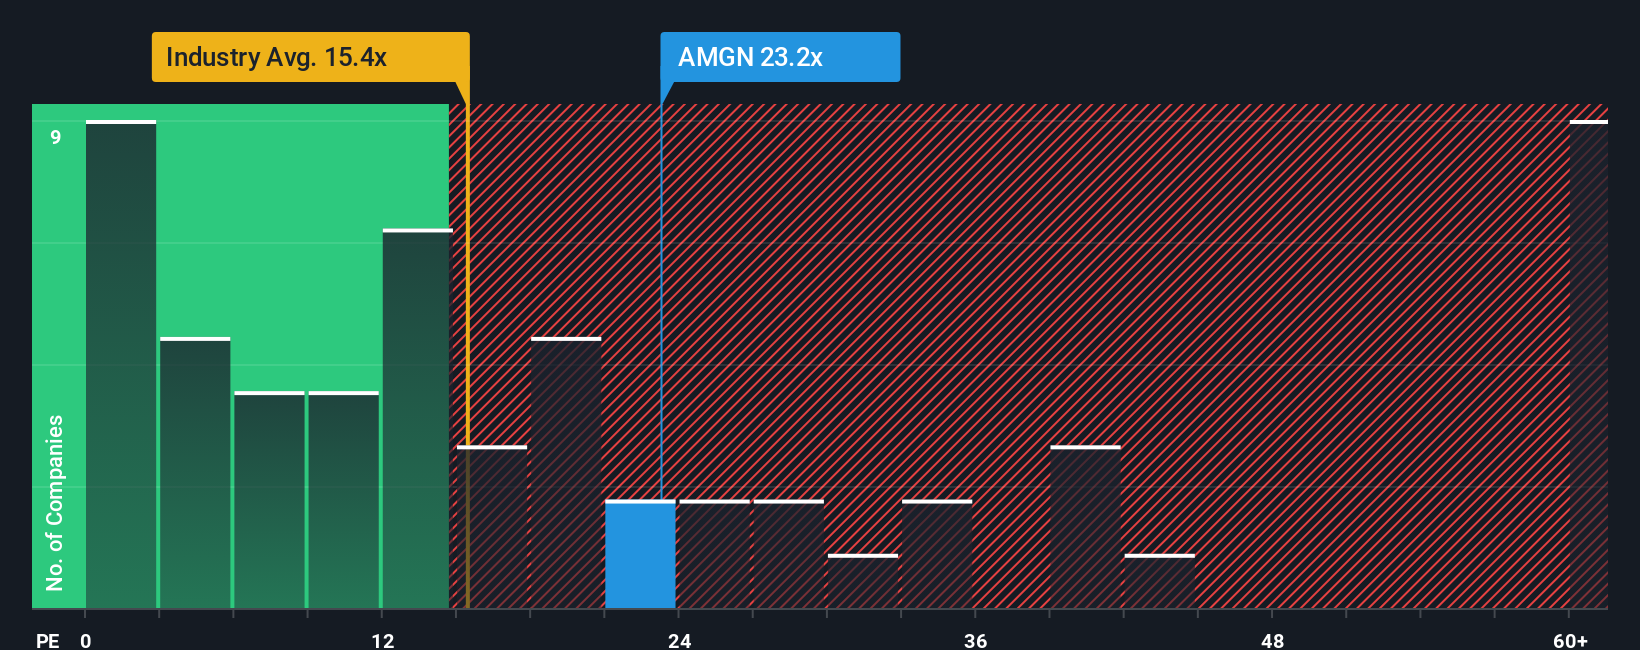
For profitable companies like Amgen, the price-to-earnings (PE) ratio is a widely used metric because it allows investors to quickly compare how much they are paying for each dollar of earnings. This makes the PE ratio especially useful for established firms in mature industries, where consistent profits reflect operational strength.
However, it is important to recognize that a “fair” PE ratio is not one-size-fits-all. Growth expectations and perceived risk play big roles in shaping what multiple the market is willing to pay. Companies expected to grow faster, or those perceived as safer, often attract higher PE ratios, while riskier or slower-growth businesses will usually see lower ones.
Looking at Amgen, its current PE ratio sits at 23.5x. This is notably higher than the biotech industry average of 15.2x, but well below the average for its direct peers, which is 40.4x. To add more nuance, Simply Wall St’s proprietary Fair Ratio for Amgen is 27.1x, calculated by factoring in growth rates, profit margins, market cap, risk profile, and other company-specific data. These are elements that raw industry and peer comparisons can miss.
The benefit of using the Fair Ratio is that it tailors the benchmark to Amgen’s specific fundamentals rather than relying on broad averages that might not capture its actual prospects or challenges. This makes the Fair Ratio a more comprehensive tool for judging value.
Comparing Amgen's current PE ratio (23.5x) to its Fair Ratio (27.1x), the stock appears to be undervalued by this measure, trading below where you would expect given its overall financial health and outlook.
Result: UNDERVALUED
Upgrade Your Decision Making: Choose your Amgen Narrative
Earlier, we mentioned that there is an even better way to understand valuation, so let’s introduce you to Narratives—a smarter, more dynamic approach to stock analysis. A Narrative goes beyond the numbers by letting you outline your own story for a company. You set your assumptions about its future revenue, profit margins, and fair value, and link these to the factors you believe matter most for Amgen’s outlook.
By connecting a company’s story to its financial forecast and then to a fair value, Narratives empower you to make investment decisions that reflect your unique perspective, rather than just relying on a single estimate or consensus. Narratives are easy to create and access on Simply Wall St’s Community page, where millions of investors compare their views and see how their scenarios stack up against current market prices.
Narratives help you decide when to buy or sell by clearly showing how your Fair Value compares to today’s share price. They update automatically whenever relevant news, earnings, or new data becomes available. For Amgen, one investor might see a future Fair Value as high as $403 due to a booming pipeline and rising margins, while another might project a more cautious $220 because of pricing and patent risks. These contrasting narratives make it simple to check your own logic and adjust your stance as new information emerges.
For Amgen, however, we'll make it really easy for you with previews of two leading Amgen Narratives:
🐂 Amgen Bull CaseFair Value: $402.91
Current price is 28.4% below fair value
Revenue growth assumption: 7.0%
- Expanding global reach and AI-driven R&D are expected to drive frequent, high-impact product launches as well as sustained revenue and margin growth.
- Amgen’s resilient business model, global expansion, and strong M&A capacity are positioned to unlock long-term earnings growth and broaden the company’s market presence.
- Risks include drug price controls, patent expirations, rising R&D costs, and the potential for acquisition or biosimilar setbacks. The bullish view assumes these challenges are outweighed by effective execution and innovation.
Fair Value: $220.17
Current price is 31.0% above fair value
Revenue growth assumption: -0.3%
- Heavy reliance on aging blockbuster drugs and upcoming patent cliffs could erode revenue and compress profit margins as biosimilar competition intensifies.
- Persistent regulatory and pricing pressures, along with acquisition integration challenges and rising costs, may limit profitability and constrain long-term growth potential.
- Despite these risks, new product launches, a sizeable pipeline, and operational efficiencies may provide some resilience; however, the narrative remains cautious due to projected earnings decline and ongoing industry headwinds.
This article by Simply Wall St is general in nature. We provide commentary based on historical data and analyst forecasts only using an unbiased methodology and our articles are not intended to be financial advice. It does not constitute a recommendation to buy or sell any stock, and does not take account of your objectives, or your financial situation. We aim to bring you long-term focused analysis driven by fundamental data. Note that our analysis may not factor in the latest price-sensitive company announcements or qualitative material. Simply Wall St has no position in any stocks mentioned.
New: Manage All Your Stock Portfolios in One Place
We've created the ultimate portfolio companion for stock investors, and it's free.
• Connect an unlimited number of Portfolios and see your total in one currency
• Be alerted to new Warning Signs or Risks via email or mobile
• Track the Fair Value of your stocks
Have feedback on this article? Concerned about the content? Get in touch with us directly. Alternatively, email editorial-team@simplywallst.com
About NasdaqGS:AMGN
Amgen
Amgen Inc. discovers, develops, manufactures, and delivers human therapeutics worldwide.
Established dividend payer and good value.
Similar Companies
Market Insights


Advertisement
Community Narratives
The Next Phase of Defense AI: A Robotic Response to America’s Security Gaps
Fair Value US$12.00|54.3% undervalued
MA
Community Contributor
Figma (FIG): The S&P 500’s Design Standard Turning Into an All-in-One Platform
Fair Value US$65.70|7.2% overvalued
TI
Community Contributor
Sleep Cycle's Revenue Set to Rise 10% with Strong Revenue Model
Fair Value SEK 38.04|25.3% undervalued
MA
Community Contributor
Has JB Hi-Fi Lost Its Point of Difference?
Fair Value AU$76.00|51.4% overvalued
RO
Community Contributor