
Advertisement
- United States
- /
- Biotech
- /
- NasdaqCM:ACET
Adicet Bio, Inc. (NASDAQ:ACET) Shares Could Be 50% Below Their Intrinsic Value Estimate
Key Insights
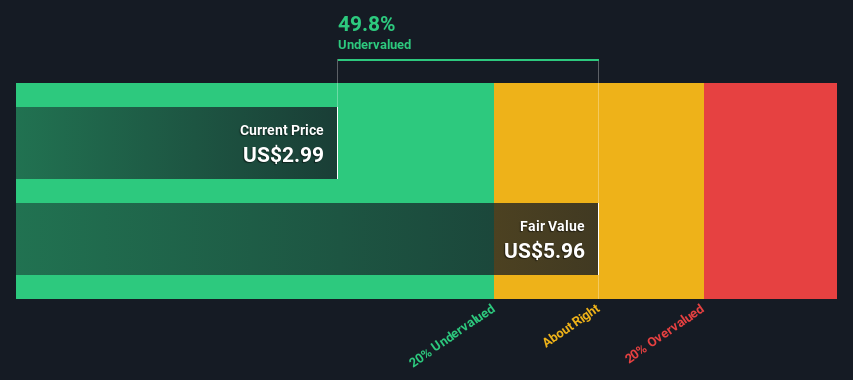
- Adicet Bio's estimated fair value is US$5.96 based on 2 Stage Free Cash Flow to Equity
- Adicet Bio's US$2.99 share price signals that it might be 50% undervalued
- Our fair value estimate is 53% lower than Adicet Bio's analyst price target of US$12.80
Does the February share price for Adicet Bio, Inc. (NASDAQ:ACET) reflect what it's really worth? Today, we will estimate the stock's intrinsic value by taking the expected future cash flows and discounting them to their present value. We will use the Discounted Cash Flow (DCF) model on this occasion. Before you think you won't be able to understand it, just read on! It's actually much less complex than you'd imagine.
We generally believe that a company's value is the present value of all of the cash it will generate in the future. However, a DCF is just one valuation metric among many, and it is not without flaws. If you still have some burning questions about this type of valuation, take a look at the Simply Wall St analysis model.
View our latest analysis for Adicet Bio
The Calculation
We are going to use a two-stage DCF model, which, as the name states, takes into account two stages of growth. The first stage is generally a higher growth period which levels off heading towards the terminal value, captured in the second 'steady growth' period. To start off with, we need to estimate the next ten years of cash flows. Where possible we use analyst estimates, but when these aren't available we extrapolate the previous free cash flow (FCF) from the last estimate or reported value. We assume companies with shrinking free cash flow will slow their rate of shrinkage, and that companies with growing free cash flow will see their growth rate slow, over this period. We do this to reflect that growth tends to slow more in the early years than it does in later years.
Generally we assume that a dollar today is more valuable than a dollar in the future, so we need to discount the sum of these future cash flows to arrive at a present value estimate:
10-year free cash flow (FCF) estimate
| 2024 | 2025 | 2026 | 2027 | 2028 | 2029 | 2030 | 2031 | 2032 | 2033 | |
| Levered FCF ($, Millions) | -US$106.7m | -US$114.8m | -US$96.0m | -US$28.3m | US$13.8m | US$20.8m | US$28.4m | US$35.8m | US$42.5m | US$48.4m |
| Growth Rate Estimate Source | Analyst x3 | Analyst x3 | Analyst x2 | Analyst x2 | Analyst x2 | Est @ 50.87% | Est @ 36.27% | Est @ 26.06% | Est @ 18.91% | Est @ 13.90% |
| Present Value ($, Millions) Discounted @ 6.2% | -US$100 | -US$102 | -US$80.1 | -US$22.2 | US$10.2 | US$14.5 | US$18.6 | US$22.1 | US$24.7 | US$26.5 |
("Est" = FCF growth rate estimated by Simply Wall St)
Present Value of 10-year Cash Flow (PVCF) = -US$188m
We now need to calculate the Terminal Value, which accounts for all the future cash flows after this ten year period. For a number of reasons a very conservative growth rate is used that cannot exceed that of a country's GDP growth. In this case we have used the 5-year average of the 10-year government bond yield (2.2%) to estimate future growth. In the same way as with the 10-year 'growth' period, we discount future cash flows to today's value, using a cost of equity of 6.2%.
Terminal Value (TV)= FCF2033 × (1 + g) ÷ (r – g) = US$48m× (1 + 2.2%) ÷ (6.2%– 2.2%) = US$1.2b
Present Value of Terminal Value (PVTV)= TV / (1 + r)10= US$1.2b÷ ( 1 + 6.2%)10= US$677m
The total value, or equity value, is then the sum of the present value of the future cash flows, which in this case is US$489m. In the final step we divide the equity value by the number of shares outstanding. Relative to the current share price of US$3.0, the company appears quite good value at a 50% discount to where the stock price trades currently. Remember though, that this is just an approximate valuation, and like any complex formula - garbage in, garbage out.
The Assumptions
We would point out that the most important inputs to a discounted cash flow are the discount rate and of course the actual cash flows. Part of investing is coming up with your own evaluation of a company's future performance, so try the calculation yourself and check your own assumptions. The DCF also does not consider the possible cyclicality of an industry, or a company's future capital requirements, so it does not give a full picture of a company's potential performance. Given that we are looking at Adicet Bio as potential shareholders, the cost of equity is used as the discount rate, rather than the cost of capital (or weighted average cost of capital, WACC) which accounts for debt. In this calculation we've used 6.2%, which is based on a levered beta of 0.800. Beta is a measure of a stock's volatility, compared to the market as a whole. We get our beta from the industry average beta of globally comparable companies, with an imposed limit between 0.8 and 2.0, which is a reasonable range for a stable business.
SWOT Analysis for Adicet Bio
Strength
- Currently debt free.
Weakness
- Shareholders have been diluted in the past year.
Opportunity
- Forecast to reduce losses next year.
- Trading below our estimate of fair value by more than 20%.
Threat
- Has less than 3 years of cash runway based on current free cash flow.
- Not expected to become profitable over the next 3 years.
Moving On:
Whilst important, the DCF calculation ideally won't be the sole piece of analysis you scrutinize for a company. DCF models are not the be-all and end-all of investment valuation. Preferably you'd apply different cases and assumptions and see how they would impact the company's valuation. If a company grows at a different rate, or if its cost of equity or risk free rate changes sharply, the output can look very different. Why is the intrinsic value higher than the current share price? For Adicet Bio, there are three further elements you should look at:
- Risks: We feel that you should assess the 4 warning signs for Adicet Bio (3 are a bit unpleasant!) we've flagged before making an investment in the company.
- Future Earnings: How does ACET's growth rate compare to its peers and the wider market? Dig deeper into the analyst consensus number for the upcoming years by interacting with our free analyst growth expectation chart.
- Other High Quality Alternatives: Do you like a good all-rounder? Explore our interactive list of high quality stocks to get an idea of what else is out there you may be missing!
PS. Simply Wall St updates its DCF calculation for every American stock every day, so if you want to find the intrinsic value of any other stock just search here.
New: Manage All Your Stock Portfolios in One Place
We've created the ultimate portfolio companion for stock investors, and it's free.
• Connect an unlimited number of Portfolios and see your total in one currency
• Be alerted to new Warning Signs or Risks via email or mobile
• Track the Fair Value of your stocks
Have feedback on this article? Concerned about the content? Get in touch with us directly. Alternatively, email editorial-team (at) simplywallst.com.
This article by Simply Wall St is general in nature. We provide commentary based on historical data and analyst forecasts only using an unbiased methodology and our articles are not intended to be financial advice. It does not constitute a recommendation to buy or sell any stock, and does not take account of your objectives, or your financial situation. We aim to bring you long-term focused analysis driven by fundamental data. Note that our analysis may not factor in the latest price-sensitive company announcements or qualitative material. Simply Wall St has no position in any stocks mentioned.
About NasdaqCM:ACET
Adicet Bio
A clinical stage biotechnology company, discovers and develops allogeneic gamma delta T cell therapies for autoimmune diseases and cancer in the United States.
Flawless balance sheet with slight risk.
Similar Companies
Market Insights

Advertisement
Community Narratives
MINISO's fair value is projected at 26.69 with an anticipated PE ratio shift of 20x
Fair Value US$24.03|11.0% undervalued
BE
Community Contributor
Procter & Gamble: A Dividend Giant Facing Slowing Growth
Fair Value US$119.81|23.3% overvalued
AN
Community Contributor
Eli Lilly's Future Growth Driven by Tirzepatide and Favorable Market Conditions
Fair Value US$1.19k|13.8% undervalued
EA
Community Contributor