Advertisement
- United States
- /
- Media
- /
- NYSE:TGNA
Does TEGNA's 34% Jump Signal More Gains Ahead in 2025?

Simply Wall St
Reviewed by Bailey Pemberton
So, you are thinking about what to do with your TEGNA shares, or maybe whether now is the time to buy in. You are not alone. TEGNA’s stock has been on something of a journey, with short-term dips but an impressive long-view. Over the last seven days, the price ticked down by 0.3%, and if you zoom out to the past month, it is down around 4.1%. Those stumbles may have you questioning sentiment, but step back even further and the narrative brightens: year-to-date, TEGNA is up 7.1%, and for the past year, it has soared 34.4%. Anyone who held on for five years has seen an almost 88% gain.
It is not just share price momentum that stands out. In terms of value, TEGNA scores a solid 5 out of 6 by traditional undervaluation checks. This suggests it is hitting the mark for investors looking for assets priced well below their true worth, with only one minor miss holding it back from a perfect score. Market dynamics, including ongoing changes in broadcast media and shifting investor expectations, continue to shape perceptions of risk and reward in the sector. But numbers do not lie; there is depth behind the recent growth.
Of course, the real question is, how do we know TEGNA is truly undervalued? We will break down each valuation approach the pros use, and before we are done, I will show you a perspective on valuation that cuts even deeper than the usual metrics.
Approach 1: TEGNA Discounted Cash Flow (DCF) Analysis
The Discounted Cash Flow (DCF) model is a fundamental approach for estimating a company’s true value. It works by projecting a company’s expected cash flows into the future, then discounting those figures back to today’s value. This method helps investors determine how much the business is worth right now, based on its future earning potential.
For TEGNA, the most recent free cash flow stood at $570 million. Analyst estimates provide detailed projections for the next several years, with 2026 expected to reach $619 million. Looking further ahead, Simply Wall St’s extrapolations bring the projected free cash flow for 2029 to around $425 million. All values are stated in US dollars. As is typical with DCFs, these forecasts are based on a range of expert sources alongside modeled assumptions.
After plugging all these numbers into a two-stage Free Cash Flow to Equity DCF, the intrinsic value per share comes out to $42.14. This implies that TEGNA is trading at a 52.3% discount to its estimated fair value today.
Result: UNDERVALUED
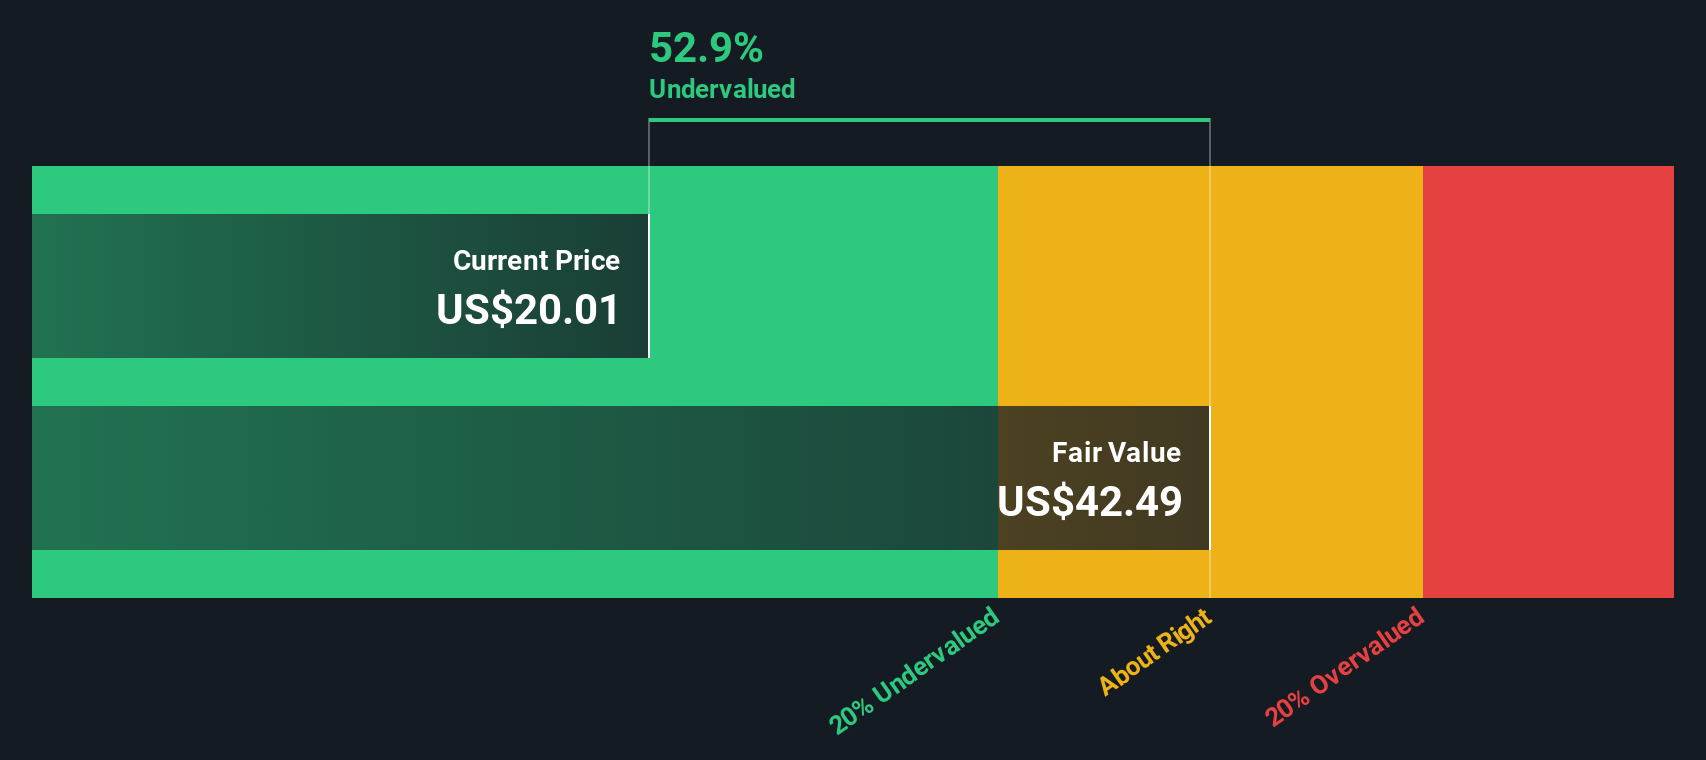
Our Discounted Cash Flow (DCF) analysis suggests TEGNA is undervalued by 52.3%. Track this in your watchlist or portfolio, or discover more undervalued stocks.
Approach 2: TEGNA Price vs Earnings (P/E Ratio)
The price-to-earnings (P/E) ratio is often the go-to valuation tool for profitable companies like TEGNA. It reflects what investors are willing to pay today for a dollar of earnings tomorrow. A “normal” or fair P/E ratio is influenced not just by profitability, but also by how the market views the company’s growth prospects and the risks unique to its business and industry.
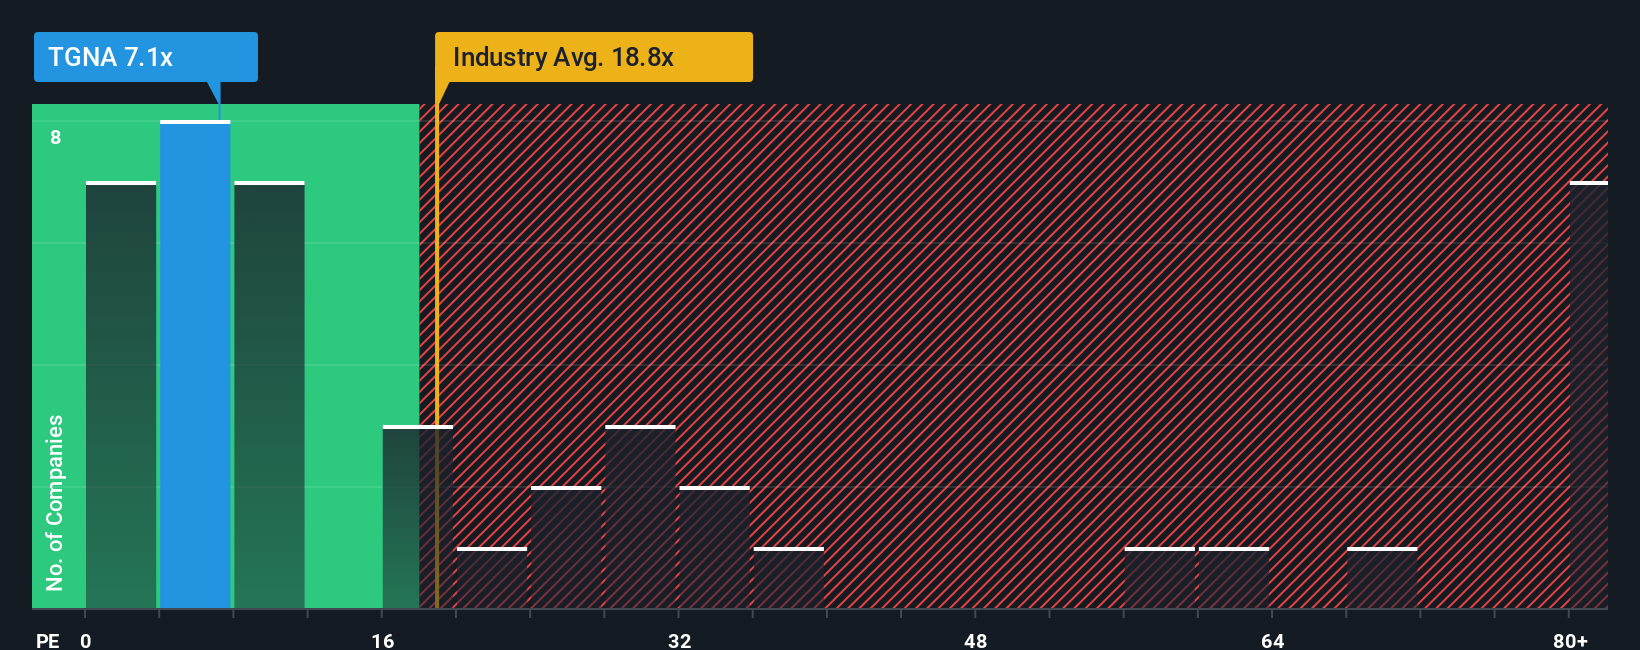
TEGNA currently trades at a P/E ratio of 7.16x, which is well below the Media industry average of 20.80x and its peer group’s average of 11.54x. At first glance, this significant gap could suggest the market is overlooking TEGNA’s earnings strength. However, looking at relative multiples alone can be misleading if growth rate, margins, or risks are meaningfully different across companies.
This is where Simply Wall St’s “Fair Ratio” comes in. It is a tailored benchmark that factors in specifics like TEGNA’s earnings growth, industry segment, profit margins, company size, and risk profile. For TEGNA, the Fair P/E Ratio is 15.63x, which is more than double its current valuation. Because this Fair Ratio is more context-aware than raw peer or industry comparisons, it serves as a more reliable yardstick for judging value.
Since TEGNA’s actual P/E of 7.16x is significantly below the Fair Ratio, this evidence suggests the stock may be undervalued based on this metric.
Result: UNDERVALUED
PE ratios tell one story, but what if the real opportunity lies elsewhere? Discover companies where insiders are betting big on explosive growth.
Upgrade Your Decision Making: Choose your TEGNA Narrative
Earlier we mentioned that there is an even better way to understand valuation, so let’s introduce you to Narratives, a tool that helps you connect your own story about TEGNA to the numbers, like your fair value and forecasts for revenue, earnings, and margins.
Think of a Narrative as your personal investment thesis made tangible. It links what you believe about the company’s future to a transparent, dynamic forecast, and then to a fair value based on your assumptions. This means you can frame TEGNA’s outlook in a way that makes sense for you, rather than just relying on numbers in isolation.
Narratives are available right within Simply Wall St’s Community page, and millions of investors use them to share their perspectives, challenge assumptions, and track how events or new data affect their view. Because Narratives automatically update when new company news, earnings, or developments arise, you’re always working with the latest information, with no more outdated models.
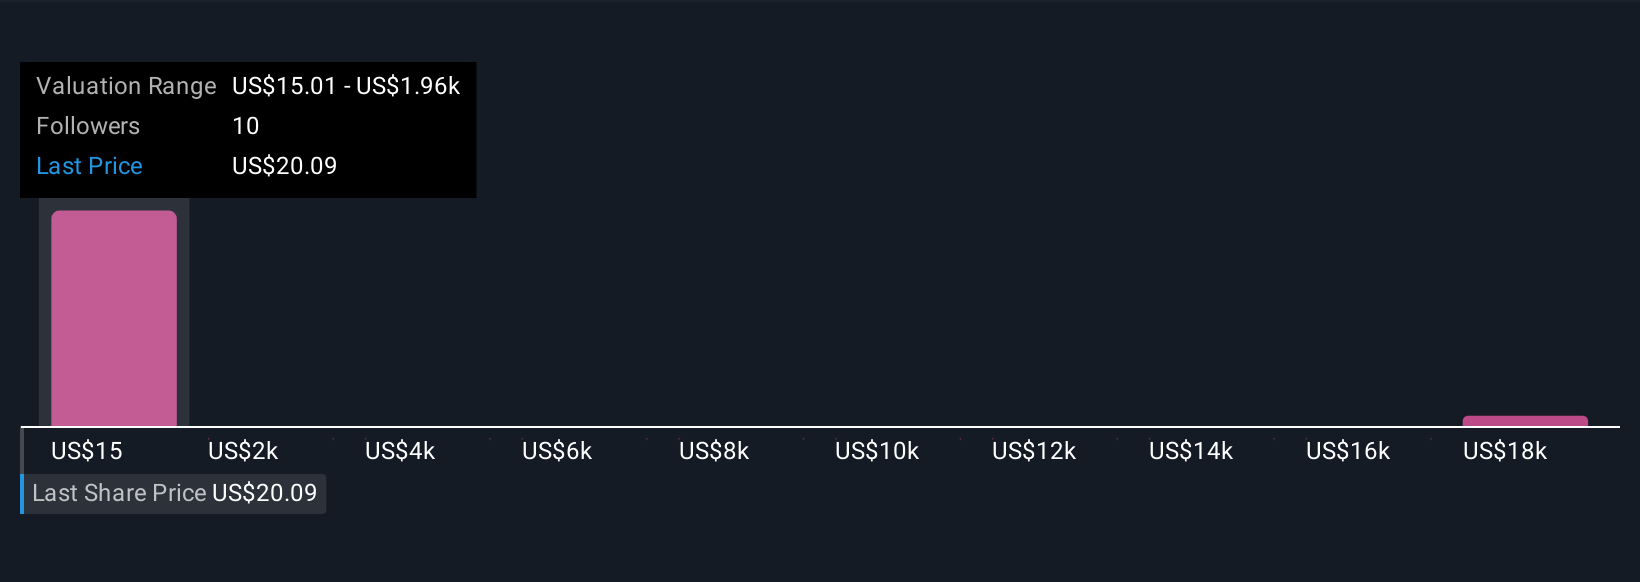
For example, one investor could see negative revenue growth and shrinking profit margins and set a fair value near $21.33. Another, optimistic about digital expansion and efficiency gains, could justify a price target well above $25. Narratives let you see and compare these stories, making it easier to judge whether TEGNA is a buy, a hold, or a sell at today’s price.
Do you think there's more to the story for TEGNA? Create your own Narrative to let the Community know!
This article by Simply Wall St is general in nature. We provide commentary based on historical data and analyst forecasts only using an unbiased methodology and our articles are not intended to be financial advice. It does not constitute a recommendation to buy or sell any stock, and does not take account of your objectives, or your financial situation. We aim to bring you long-term focused analysis driven by fundamental data. Note that our analysis may not factor in the latest price-sensitive company announcements or qualitative material. Simply Wall St has no position in any stocks mentioned.
Valuation is complex, but we're here to simplify it.
Discover if TEGNA might be undervalued or overvalued with our detailed analysis, featuring fair value estimates, potential risks, dividends, insider trades, and its financial condition.
Access Free AnalysisHave feedback on this article? Concerned about the content? Get in touch with us directly. Alternatively, email editorial-team@simplywallst.com
About NYSE:TGNA
Undervalued with adequate balance sheet.
Similar Companies
Market Insights

Advertisement
Community Narratives
The Next Phase of Energy Storage: How NeoVolta Is Tackling America’s Power Crunch
Fair Value US$7.50|35.1% undervalued
MA
Community Contributor
Why EnSilica is Worth Possibly 13x its Current Price
Fair Value UK£5.00|89.5% undervalued
DO
Community Contributor
M&A Activity, Industry Diversification & A Defense Contract Monopoly Will Push BWXT For Healthy Long-Term Growth
Fair Value US$220.00|15.2% undervalued
CL
Community Contributor
A case for Cassiar Gold Corp (TSXV: GLDC) to reach CAD$8-10 before 2030 (X30-37)
Fair Value CA$10.00|96.0% undervalued
AG
Community Contributor