Advertisement
- United States
- /
- Interactive Media and Services
- /
- NYSE:SNAP
Assessing Snap’s Share Price After a 24.5% Weekly Surge and Analyst Upgrades

Simply Wall St
Reviewed by Bailey Pemberton
- Thinking about Snap and wondering if it might finally be a value play? You're not alone, especially with all the chatter about tech stocks making a comeback.
- Recently, Snap's stock jumped 24.5% in just one week and climbed 12.9% this month, even though it's still down over the past year and longer. These are signs that investor sentiment may be shifting fast.
- There's been a flurry of attention as Snap announced new features to improve user engagement, and a handful of analyst upgrades have hit the headlines lately. These developments are fueling optimism that the company could be turning a corner, which helps explain the recent surge in share price.
- For those focused on value, Snap chalks up a valuation score of 4 out of 6 on our checks. Let's break down what that really means and how it stacks up to various valuation approaches. Stick around, because we'll also hint at a smarter way to use valuation by the end of the article.
Find out why Snap's -18.2% return over the last year is lagging behind its peers.
Approach 1: Snap Discounted Cash Flow (DCF) Analysis
The Discounted Cash Flow (DCF) model estimates what a company is worth by forecasting its future cash flows and then discounting those amounts back to today’s value. Essentially, it tries to pin down what an investor would pay now for all the cash Snap is expected to generate in the years ahead.
Snap's latest reported Free Cash Flow sits at $390.4 Million, and analyst models expect that number to climb sharply over the coming years. In fact, by 2029, the projected Free Cash Flow reaches $1.45 Billion. Estimates for the next decade continue to rise based on current growth rates and Simply Wall St's longer-term extrapolations.
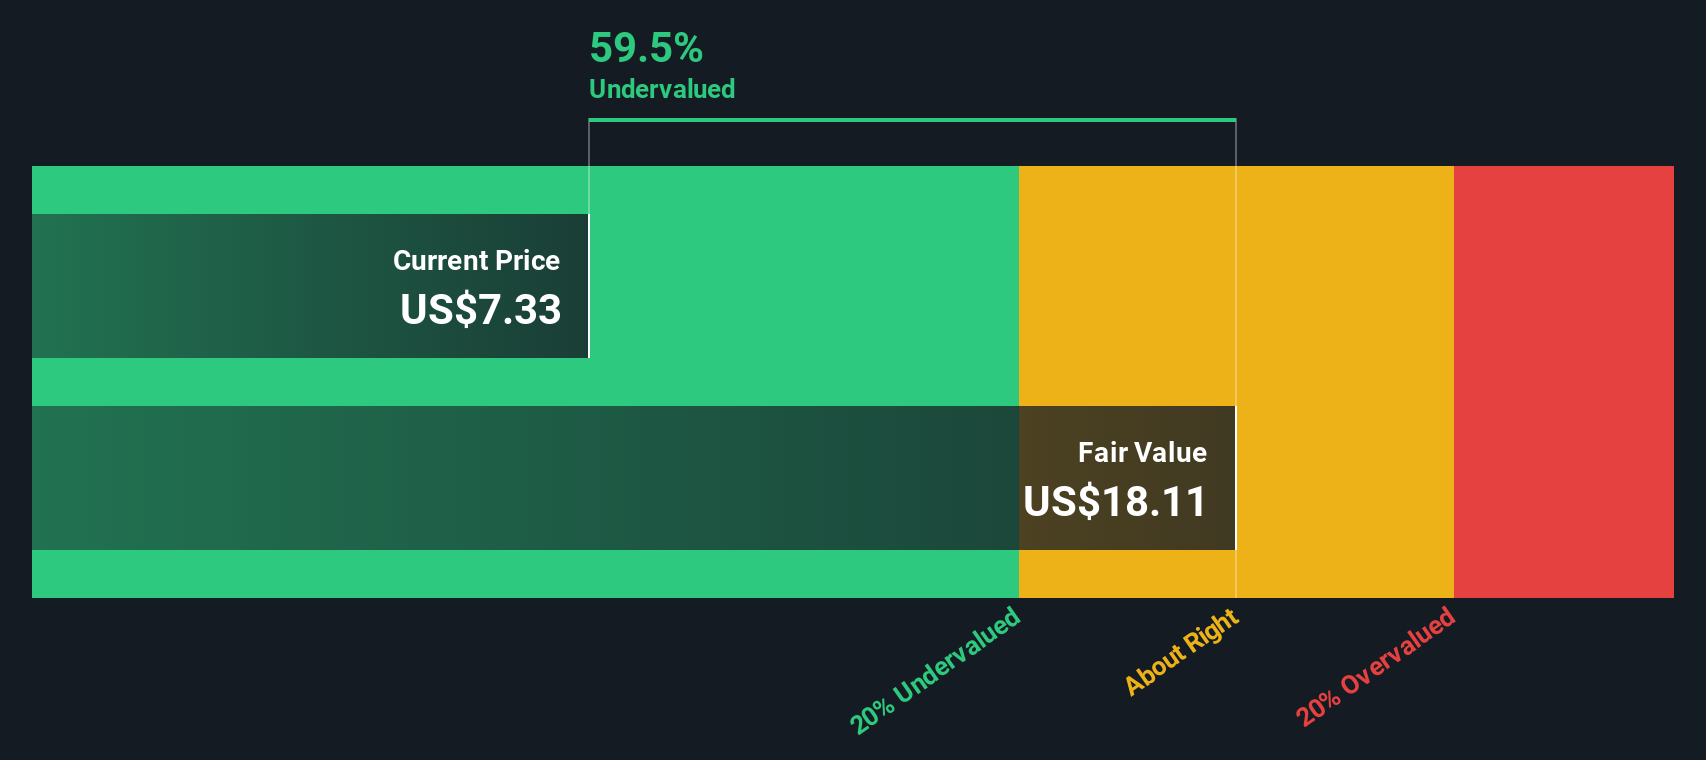
According to this model, Snap's intrinsic value lands at $17.41 per share. That figure is based on a 2 Stage Free Cash Flow to Equity approach, which incorporates both near-term analyst forecasts and longer-term assumptions. Compared to where Snap is trading now, the DCF model suggests the stock is notably undervalued by about 47.8%.
If you're searching for a margin of safety, this model indicates that there is still significant upside if Snap delivers on its cash flow potential.
Result: UNDERVALUED
Our Discounted Cash Flow (DCF) analysis suggests Snap is undervalued by 47.8%. Track this in your watchlist or portfolio, or discover 863 more undervalued stocks based on cash flows.
Approach 2: Snap Price vs Sales
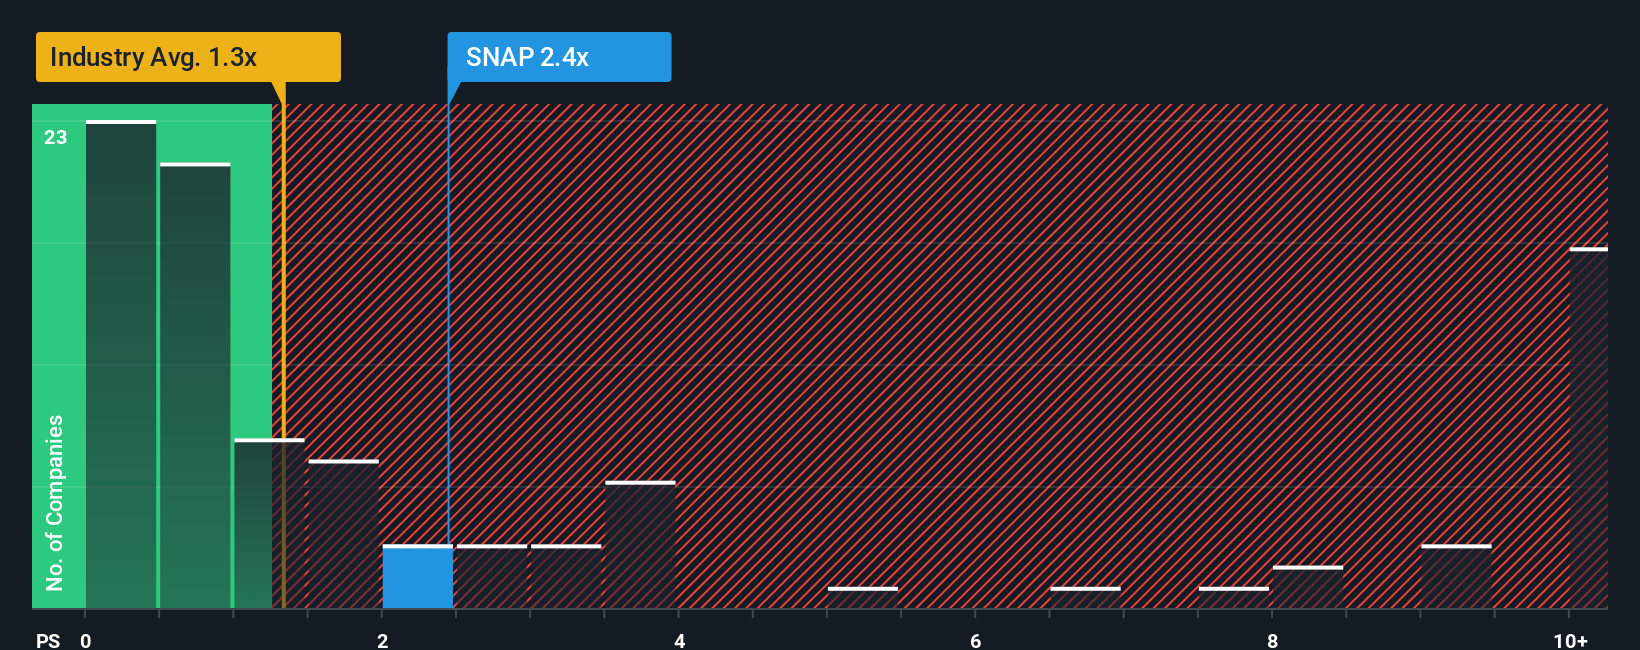
When evaluating companies that are not yet profitable, the Price-to-Sales (P/S) ratio is often the go-to valuation metric. This is because the P/S ratio focuses on a company's ability to generate revenue rather than profits, which may not yet be consistent for high-growth tech firms like Snap.
A “normal” or “fair” P/S ratio for any business is influenced by factors such as expected growth rates and risks. Rapidly growing companies or those operating in less risky industries can often justify higher multiples, while more mature or riskier names might trade at lower ones. Essentially, investors are willing to pay more for each dollar of sales if they expect sales to grow significantly in the future with less risk attached.
Right now, Snap trades at a P/S ratio of 2.7x. To put that in perspective, the average for Interactive Media and Services peers is 3.16x, and the industry-wide average stands at 1.38x.
Simply Wall St's “Fair Ratio” in this context, 2.86x, applies a data-driven lens that considers Snap’s growth outlook, margins, scale, risk factors, and where it sits in its industry. This number gives a more nuanced benchmark than simply matching up to peers or industry averages, as it filters in forward-looking potential and unique risks, instead of focusing solely on the past or broader market sentiment.
When you compare Snap’s actual P/S ratio of 2.7x with its Fair Ratio of 2.86x, the difference is less than 0.10. That points to Snap being priced just about right at current levels based on its sales and fundamentals.
Result: ABOUT RIGHT
PS ratios tell one story, but what if the real opportunity lies elsewhere? Discover 1368 companies where insiders are betting big on explosive growth.
Upgrade Your Decision Making: Choose your Snap Narrative
Earlier we mentioned that there's an even better way to understand valuation, so let's introduce you to Narratives, a smarter and more dynamic approach to investing that is built around your own perspective and expectations.
A Narrative is simply your story about a company, backed up with your view of its future revenue, earnings, profit margins, and what you think is a fair value for the stock. Instead of just looking at numbers, a Narrative connects your view of Snap's business story, such as new products, market opportunities, or risks, to a financial forecast and a fair value estimate.
This powerful tool is easy to use and available to everyone on Simply Wall St’s Community page, where millions of investors share and update their Narratives. Narratives help you decide when to buy or sell by comparing your estimated Fair Value to the current share price, and because they update automatically when news or earnings are released, your view always stays relevant and actionable.
For example, some Snap investors see big upside from AR products and stronger global adoption, giving price targets as high as $16, while others are more cautious given competition and profit risks, targeting just $7. With Narratives, you can see both sides, build your own, and act decisively with confidence.
Do you think there's more to the story for Snap? Head over to our Community to see what others are saying!

This article by Simply Wall St is general in nature. We provide commentary based on historical data and analyst forecasts only using an unbiased methodology and our articles are not intended to be financial advice. It does not constitute a recommendation to buy or sell any stock, and does not take account of your objectives, or your financial situation. We aim to bring you long-term focused analysis driven by fundamental data. Note that our analysis may not factor in the latest price-sensitive company announcements or qualitative material. Simply Wall St has no position in any stocks mentioned.
New: Manage All Your Stock Portfolios in One Place
We've created the ultimate portfolio companion for stock investors, and it's free.
• Connect an unlimited number of Portfolios and see your total in one currency
• Be alerted to new Warning Signs or Risks via email or mobile
• Track the Fair Value of your stocks
Have feedback on this article? Concerned about the content? Get in touch with us directly. Alternatively, email editorial-team@simplywallst.com
About NYSE:SNAP
Snap
Operates as a technology company in North America, Europe, and internationally.
Excellent balance sheet and good value.
Similar Companies
Market Insights

Advertisement
Community Narratives
MINISO's fair value is projected at 26.69 with an anticipated PE ratio shift of 20x
Fair Value US$24.03|11.0% undervalued
BE
Community Contributor
Procter & Gamble: A Dividend Giant Facing Slowing Growth
Fair Value US$119.81|23.3% overvalued
AN
Community Contributor
Eli Lilly's Future Growth Driven by Tirzepatide and Favorable Market Conditions
Fair Value US$1.19k|13.8% undervalued
EA
Community Contributor