Advertisement
- United States
- /
- Entertainment
- /
- NYSE:MANU
Assessing Manchester United Shares After Latest Ownership Talks and 24% Discount to DCF Value

Simply Wall St
Reviewed by Bailey Pemberton
Trying to decide what to do with Manchester United stock? You are definitely not alone. The last trading session closed at $15.33, and while headlines may have been quieter than usual lately, those wondering if a new era is beginning or if it is just more of the same are in good company. Whether you are an ardent supporter, a seasoned investor, or just stock-curious, Manchester United’s share price has told a story of ups and downs that is far from boring.
Over the past week, shares dipped by 0.5%, with the last month showing a deeper slide of 4.3%. The year-to-date figure is even softer at -9.7%, and zooming out over the past year puts the stock at -7.0%. But it is not all gloom: anyone who has hung on for three years would be looking at a solid 12.4% gain, and a respectable 9.9% over five years. Clearly, there has been enough movement to catch the attention of anyone tracking the club’s fortunes off the pitch as well as on it.
With the market still digesting the future of club ownership and broader sector sentiment, many investors are wondering: is Manchester United undervalued at these levels, or is the stock’s performance just part of a wider trend? Our current valuation score for the club comes in at 2 out of 6, based on traditional undervaluation checks. This suggests there may be select opportunities, but also a need for a closer look.
Let’s break down what this means by comparing different ways to value Manchester United’s shares. We will also look at an even more insightful way to think about valuation at the end of this article.
Manchester United scores just 2/6 on our valuation checks. See what other red flags we found in the full valuation breakdown.
Approach 1: Manchester United Discounted Cash Flow (DCF) Analysis
The Discounted Cash Flow (DCF) approach estimates what a business is worth today by projecting its future cash flows and discounting them back to their present value. This provides an intrinsic value for the company, based on expectations for how much cash it will generate over time.
For Manchester United, the latest reported Free Cash Flow stands at -£124.9 million. Analysts supply Free Cash Flow estimates for up to five years. Beyond that, projections come from extrapolation by valuation services, aiming to provide a complete picture of future earnings. For example, forecasted Free Cash Flow is expected to rise to £181 million in 2028, with subsequent years estimating further steady growth, reaching around £280.5 million by 2035.
By discounting each of these projected cash flows back to today using the “2 Stage Free Cash Flow to Equity” model, the resulting estimated intrinsic value of Manchester United stock is $20.28 per share. With shares most recently closing at $15.33, this suggests the stock is currently trading at a 24.4% discount to its calculated DCF value.
Result: UNDERVALUED
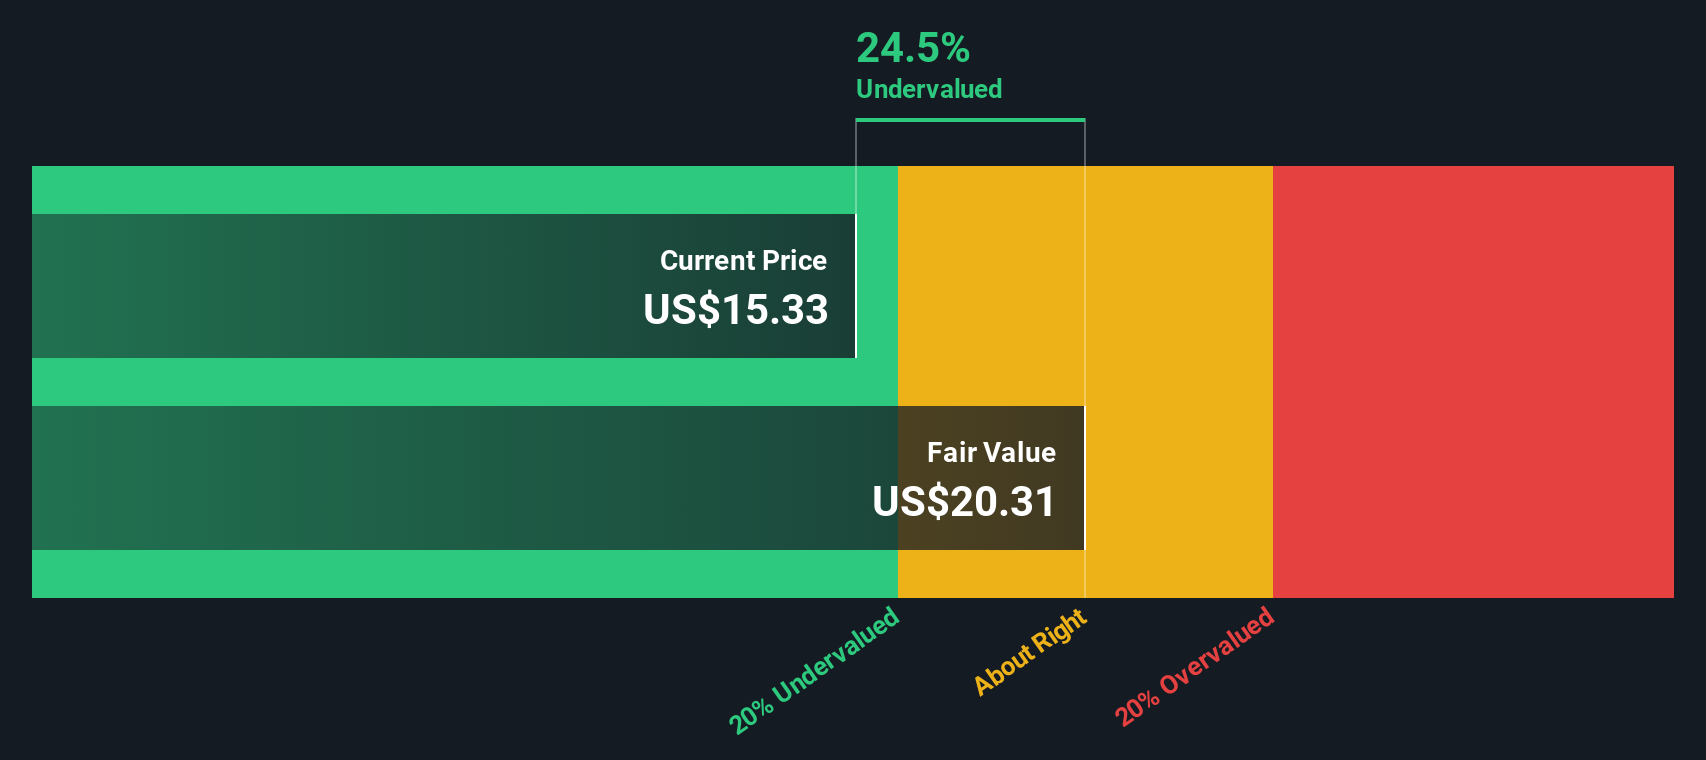
Our Discounted Cash Flow (DCF) analysis suggests Manchester United is undervalued by 24.4%. Track this in your watchlist or portfolio, or discover more undervalued stocks.
Approach 2: Manchester United Price vs Sales (P/S)
For companies where profits can swing due to factors like investments, market cycles, or unique industry economics, the Price-to-Sales (P/S) multiple is a valuable yardstick. It focuses on the relationship between a company’s market value and its sales, making it particularly useful for assessing businesses in the entertainment sector where earnings might be less predictable but revenue remains a staple indicator of scale and opportunity.
Growth expectations and risk play a major role in what makes a “normal” or “fair” P/S multiple. Investors will often pay a higher multiple for companies they believe can grow revenue quickly and sustainably, while higher risks or slowing growth can justify a lower P/S.
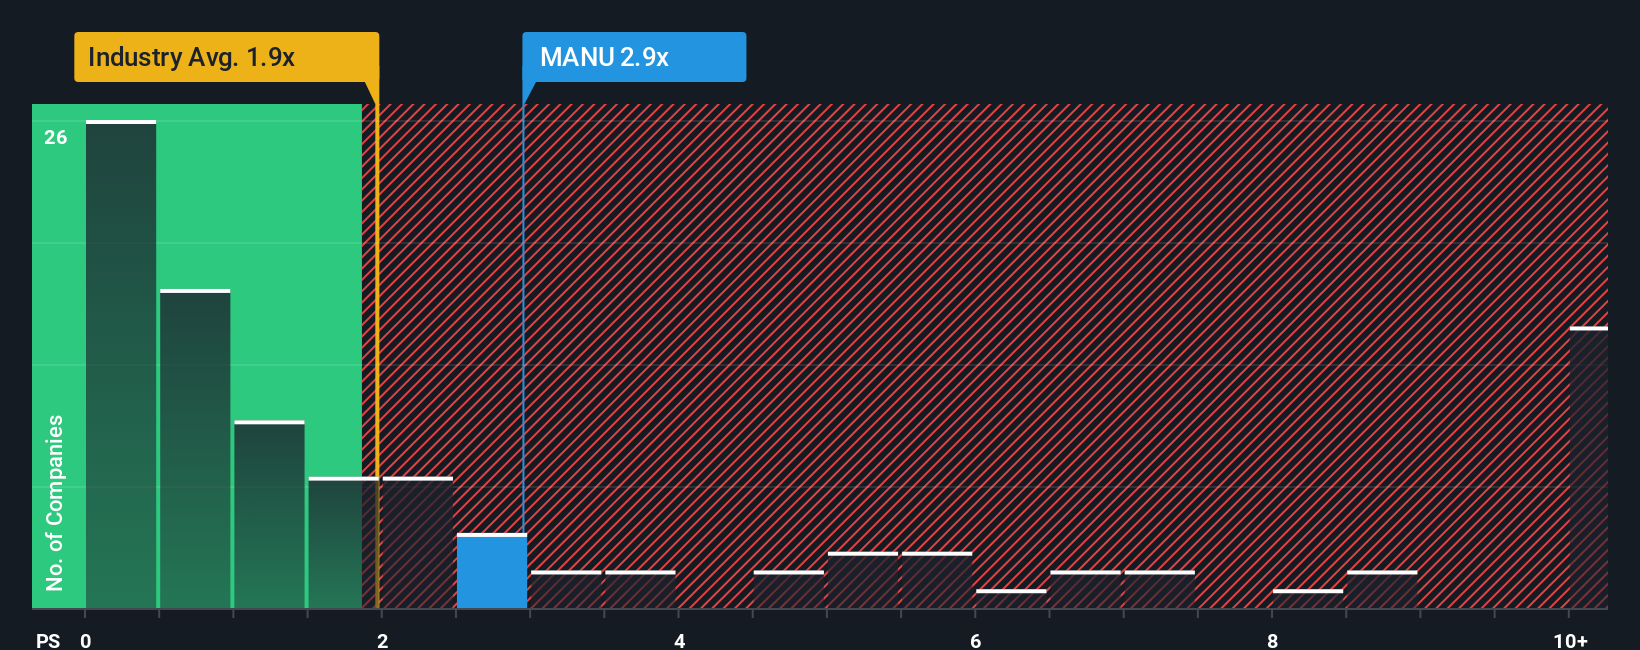
Manchester United currently trades at a P/S ratio of 2.94x. This stands above the entertainment industry average of 1.95x and is higher than the peer average of 1.44x. The “Fair Ratio” for Manchester United, as calculated by Simply Wall St, comes in at 2.12x. This figure is tailored to reflect not just how Manchester United stacks up to peers, but also its growth prospects, profit margin, market cap, and specific risks. This approach provides a well-rounded view that is much better than a simple industry comparison.
This higher-than-fair multiple signals that the stock is likely trading at a premium, with expectations for outperformance already factored in. Compared to the Fair Ratio, Manchester United’s actual P/S is materially higher.
Result: OVERVALUED
PS ratios tell one story, but what if the real opportunity lies elsewhere? Discover companies where insiders are betting big on explosive growth.
Upgrade Your Decision Making: Choose your Manchester United Narrative
Earlier we mentioned that there is an even better way to understand valuation. Let’s introduce you to Narratives. A Narrative is your personal story about a company, built around what you believe will happen with its future revenue, earnings, and margins, and what you think its shares are really worth. Narratives link Manchester United’s on- and off-pitch story directly to a financial forecast and a fair value, creating a much clearer picture for you as an investor.
On Simply Wall St's platform, Narratives are easy for anyone to create and follow, right in the Community page used by millions of investors. By comparing Narrative Fair Value with the live share price, you can see at a glance whether you believe it is time to buy, sell, or hold. Narratives update automatically whenever new news or earnings results come out, so your view always stays fresh and relevant.
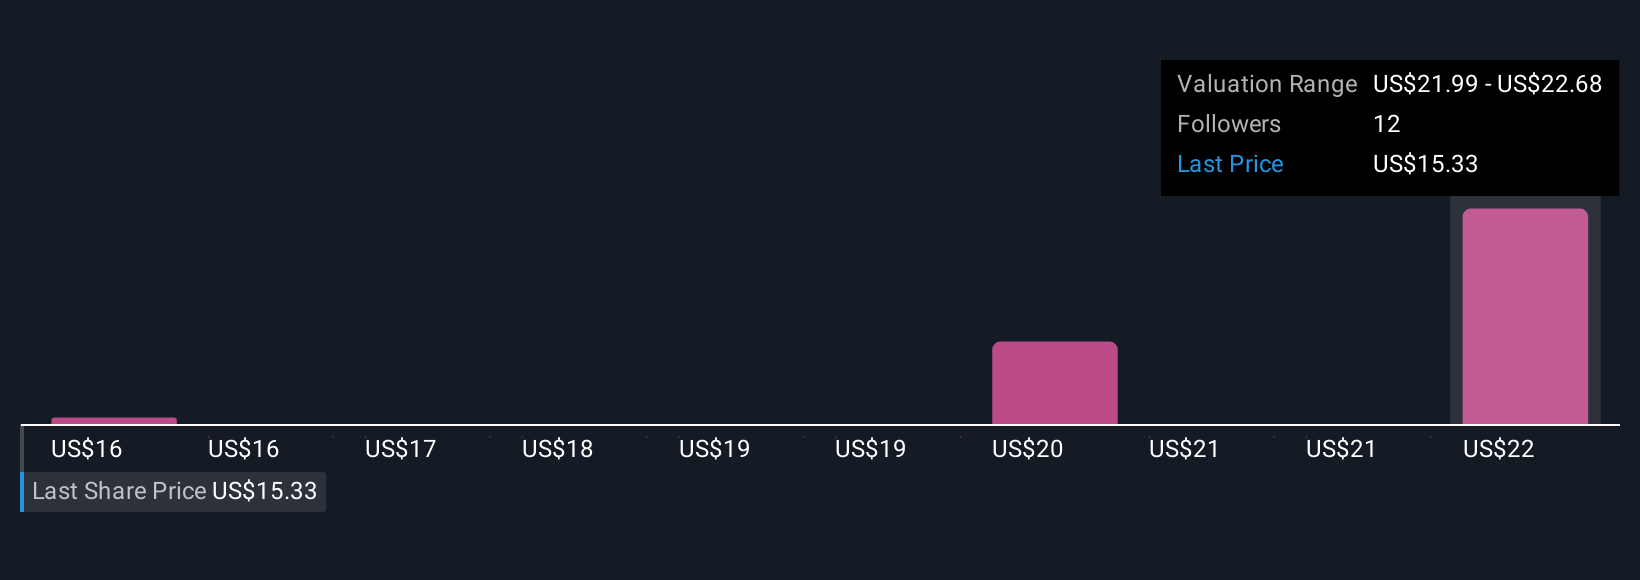
For example, some Manchester United Narratives predict a Fair Value as high as $30 per share, while others see it as low as $12. These different viewpoints reflect how investors can each have a unique angle, empowered with the latest data and their own expectations.
Do you think there's more to the story for Manchester United? Create your own Narrative to let the Community know!
This article by Simply Wall St is general in nature. We provide commentary based on historical data and analyst forecasts only using an unbiased methodology and our articles are not intended to be financial advice. It does not constitute a recommendation to buy or sell any stock, and does not take account of your objectives, or your financial situation. We aim to bring you long-term focused analysis driven by fundamental data. Note that our analysis may not factor in the latest price-sensitive company announcements or qualitative material. Simply Wall St has no position in any stocks mentioned.
New: Manage All Your Stock Portfolios in One Place
We've created the ultimate portfolio companion for stock investors, and it's free.
• Connect an unlimited number of Portfolios and see your total in one currency
• Be alerted to new Warning Signs or Risks via email or mobile
• Track the Fair Value of your stocks
Have feedback on this article? Concerned about the content? Get in touch with us directly. Alternatively, email editorial-team@simplywallst.com
About NYSE:MANU
Manchester United
Operates a professional sports team in the United Kingdom.
Moderate growth potential and slightly overvalued.
Market Insights

Advertisement
Community Narratives
The Next Phase of Energy Storage: How NeoVolta Is Tackling America’s Power Crunch
Fair Value US$7.50|35.1% undervalued
MA
Community Contributor
Why EnSilica is Worth Possibly 13x its Current Price
Fair Value UK£5.00|89.8% undervalued
DO
Community Contributor
M&A Activity, Industry Diversification & A Defense Contract Monopoly Will Push BWXT For Healthy Long-Term Growth
Fair Value US$220.00|15.2% undervalued
CL
Community Contributor
A case for Cassiar Gold Corp (TSXV: GLDC) to reach CAD$8-10 before 2030 (X30-37)
Fair Value CA$10.00|96.0% undervalued
AG
Community Contributor