- United States
- /
- Entertainment
- /
- NasdaqGS:WBD
Is Warner Bros. Discovery, Inc. (NASDAQ:WBD) Trading At A 49% Discount?


Key Insights
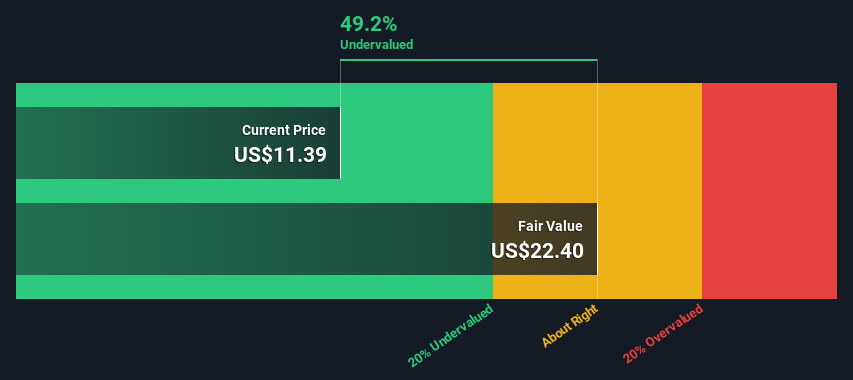
- Warner Bros. Discovery's estimated fair value is US$22.40 based on 2 Stage Free Cash Flow to Equity
- Warner Bros. Discovery is estimated to be 49% undervalued based on current share price of US$11.39
- Our fair value estimate is 35% higher than Warner Bros. Discovery's analyst price target of US$16.58
In this article we are going to estimate the intrinsic value of Warner Bros. Discovery, Inc. (NASDAQ:WBD) by projecting its future cash flows and then discounting them to today's value. The Discounted Cash Flow (DCF) model is the tool we will apply to do this. Before you think you won't be able to understand it, just read on! It's actually much less complex than you'd imagine.
Remember though, that there are many ways to estimate a company's value, and a DCF is just one method. If you want to learn more about discounted cash flow, the rationale behind this calculation can be read in detail in the Simply Wall St analysis model.
View our latest analysis for Warner Bros. Discovery
The Method
We use what is known as a 2-stage model, which simply means we have two different periods of growth rates for the company's cash flows. Generally the first stage is higher growth, and the second stage is a lower growth phase. To start off with, we need to estimate the next ten years of cash flows. Where possible we use analyst estimates, but when these aren't available we extrapolate the previous free cash flow (FCF) from the last estimate or reported value. We assume companies with shrinking free cash flow will slow their rate of shrinkage, and that companies with growing free cash flow will see their growth rate slow, over this period. We do this to reflect that growth tends to slow more in the early years than it does in later years.
Generally we assume that a dollar today is more valuable than a dollar in the future, so we discount the value of these future cash flows to their estimated value in today's dollars:
10-year free cash flow (FCF) forecast
| 2024 | 2025 | 2026 | 2027 | 2028 | 2029 | 2030 | 2031 | 2032 | 2033 | |
| Levered FCF ($, Millions) | US$5.19b | US$5.92b | US$6.30b | US$6.04b | US$5.92b | US$5.87b | US$5.88b | US$5.93b | US$6.00b | US$6.09b |
| Growth Rate Estimate Source | Analyst x14 | Analyst x12 | Analyst x5 | Analyst x2 | Est @ -2.02% | Est @ -0.75% | Est @ 0.14% | Est @ 0.77% | Est @ 1.20% | Est @ 1.51% |
| Present Value ($, Millions) Discounted @ 12% | US$4.6k | US$4.7k | US$4.5k | US$3.9k | US$3.4k | US$3.0k | US$2.7k | US$2.4k | US$2.2k | US$2.0k |
("Est" = FCF growth rate estimated by Simply Wall St)
Present Value of 10-year Cash Flow (PVCF) = US$33b
We now need to calculate the Terminal Value, which accounts for all the future cash flows after this ten year period. The Gordon Growth formula is used to calculate Terminal Value at a future annual growth rate equal to the 5-year average of the 10-year government bond yield of 2.2%. We discount the terminal cash flows to today's value at a cost of equity of 12%.
Terminal Value (TV)= FCF2033 × (1 + g) ÷ (r – g) = US$6.1b× (1 + 2.2%) ÷ (12%– 2.2%) = US$65b
Present Value of Terminal Value (PVTV)= TV / (1 + r)10= US$65b÷ ( 1 + 12%)10= US$21b
The total value, or equity value, is then the sum of the present value of the future cash flows, which in this case is US$55b. To get the intrinsic value per share, we divide this by the total number of shares outstanding. Compared to the current share price of US$11.4, the company appears quite undervalued at a 49% discount to where the stock price trades currently. Valuations are imprecise instruments though, rather like a telescope - move a few degrees and end up in a different galaxy. Do keep this in mind.
The Assumptions
Now the most important inputs to a discounted cash flow are the discount rate, and of course, the actual cash flows. If you don't agree with these result, have a go at the calculation yourself and play with the assumptions. The DCF also does not consider the possible cyclicality of an industry, or a company's future capital requirements, so it does not give a full picture of a company's potential performance. Given that we are looking at Warner Bros. Discovery as potential shareholders, the cost of equity is used as the discount rate, rather than the cost of capital (or weighted average cost of capital, WACC) which accounts for debt. In this calculation we've used 12%, which is based on a levered beta of 1.921. Beta is a measure of a stock's volatility, compared to the market as a whole. We get our beta from the industry average beta of globally comparable companies, with an imposed limit between 0.8 and 2.0, which is a reasonable range for a stable business.
Next Steps:
Valuation is only one side of the coin in terms of building your investment thesis, and it shouldn't be the only metric you look at when researching a company. DCF models are not the be-all and end-all of investment valuation. Rather it should be seen as a guide to "what assumptions need to be true for this stock to be under/overvalued?" If a company grows at a different rate, or if its cost of equity or risk free rate changes sharply, the output can look very different. Can we work out why the company is trading at a discount to intrinsic value? For Warner Bros. Discovery, we've compiled three essential elements you should consider:
- Financial Health: Does WBD have a healthy balance sheet? Take a look at our free balance sheet analysis with six simple checks on key factors like leverage and risk.
- Future Earnings: How does WBD's growth rate compare to its peers and the wider market? Dig deeper into the analyst consensus number for the upcoming years by interacting with our free analyst growth expectation chart.
- Other High Quality Alternatives: Do you like a good all-rounder? Explore our interactive list of high quality stocks to get an idea of what else is out there you may be missing!
PS. The Simply Wall St app conducts a discounted cash flow valuation for every stock on the NASDAQGS every day. If you want to find the calculation for other stocks just search here.
Valuation is complex, but we're here to simplify it.
Discover if Warner Bros. Discovery might be undervalued or overvalued with our detailed analysis, featuring fair value estimates, potential risks, dividends, insider trades, and its financial condition.
Access Free AnalysisHave feedback on this article? Concerned about the content? Get in touch with us directly. Alternatively, email editorial-team (at) simplywallst.com.
This article by Simply Wall St is general in nature. We provide commentary based on historical data and analyst forecasts only using an unbiased methodology and our articles are not intended to be financial advice. It does not constitute a recommendation to buy or sell any stock, and does not take account of your objectives, or your financial situation. We aim to bring you long-term focused analysis driven by fundamental data. Note that our analysis may not factor in the latest price-sensitive company announcements or qualitative material. Simply Wall St has no position in any stocks mentioned.
About NasdaqGS:WBD
Warner Bros. Discovery
Operates as a media and entertainment company worldwide.
Undervalued with mediocre balance sheet.
Similar Companies
Market Insights

Community Narratives

