Advertisement
- United States
- /
- Media
- /
- NasdaqGS:SBGI
Is Sinclair Broadcast Group (SBGI) Pricing Reflect Its Value After Recent 9.3% Weekly Gain

Reviewed by Bailey Pemberton
- If you are looking at Sinclair and wondering whether the current share price reflects its true worth, you are not alone. This article is built to help you weigh what you are actually getting for your money.
- Over the last week Sinclair's share price moved to US$14.96, with a 9.3% return. Returns over 30 days, year to date and the last 5 years, at a 1.9% decline, 1.7% decline and 40.3% decline, paint a mixed picture for anyone thinking about risk and reward.
- Recent coverage around Sinclair has focused on the broader media sector and ongoing interest in how traditional broadcasters are positioning themselves, which helps frame how investors think about its prospects today. This context matters because it shapes sentiment around whether the current valuation is being treated as an opportunity or as a reflection of long term challenges.
- On our checks Sinclair scores 5 out of 6 on undervaluation tests, giving it a valuation score of 5/6. Next we will walk through the main valuation approaches behind that result, then finish with a way to assess value that goes beyond the usual ratios and models.
Approach 1: Sinclair Discounted Cash Flow (DCF) Analysis
A Discounted Cash Flow, or DCF, model estimates what a company could be worth today by projecting its future cash flows and then discounting those back into present value terms.
For Sinclair, the model uses a 2 Stage Free Cash Flow to Equity approach based on cash flow projections. The latest twelve month free cash flow is US$201.35 million, and analysts provide explicit forecasts up to 2028, with projected free cash flow of US$336.50 million. Beyond that, Simply Wall St extrapolates up to 2035, with annual projections ranging from about US$272.79 million in 2026 to US$522.06 million in 2035. Each projected amount is discounted back to today.
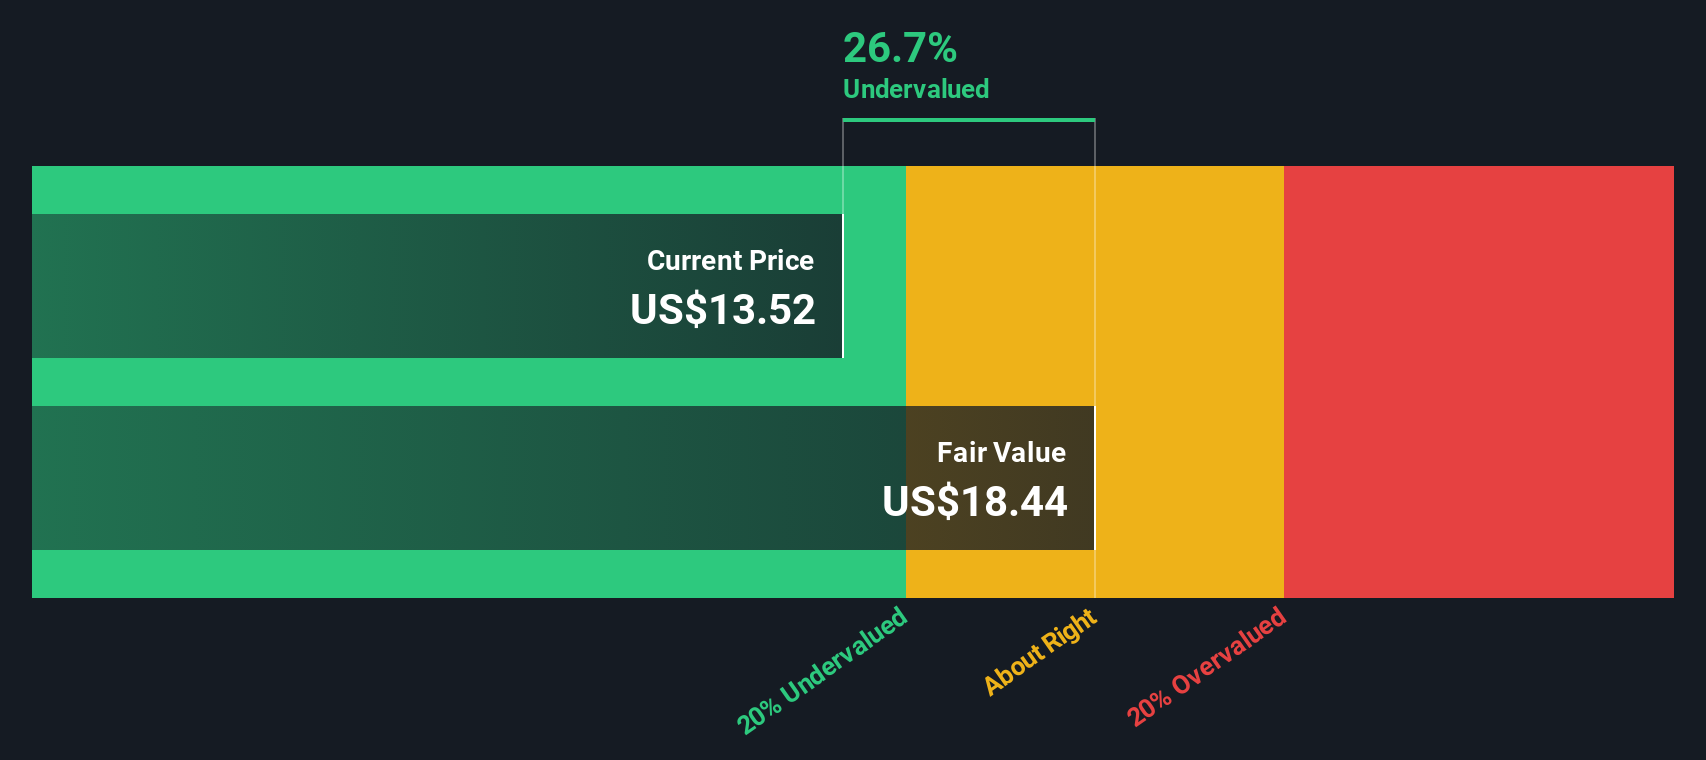
Aggregating these discounted cash flows results in an estimated intrinsic value of US$55.32 per share. Compared with the recent share price of US$14.96, the DCF output implies the stock is about 73.0% undervalued based on these assumptions and projections.
Result: UNDERVALUED
Our Discounted Cash Flow (DCF) analysis suggests Sinclair is undervalued by 73.0%. Track this in your watchlist or portfolio, or discover 53 more high quality undervalued stocks.
Approach 2: Sinclair Price vs Sales
For companies where earnings can be volatile, the P/S ratio is often a useful cross check because it ties the share price to revenue rather than profits, which can swing around with one-off items.
Investors usually pay a higher or lower P/S based on what they expect for future growth and how risky they think those sales are. Faster expected growth or more predictable revenue can justify a higher multiple, while higher uncertainty often leads to a lower multiple.
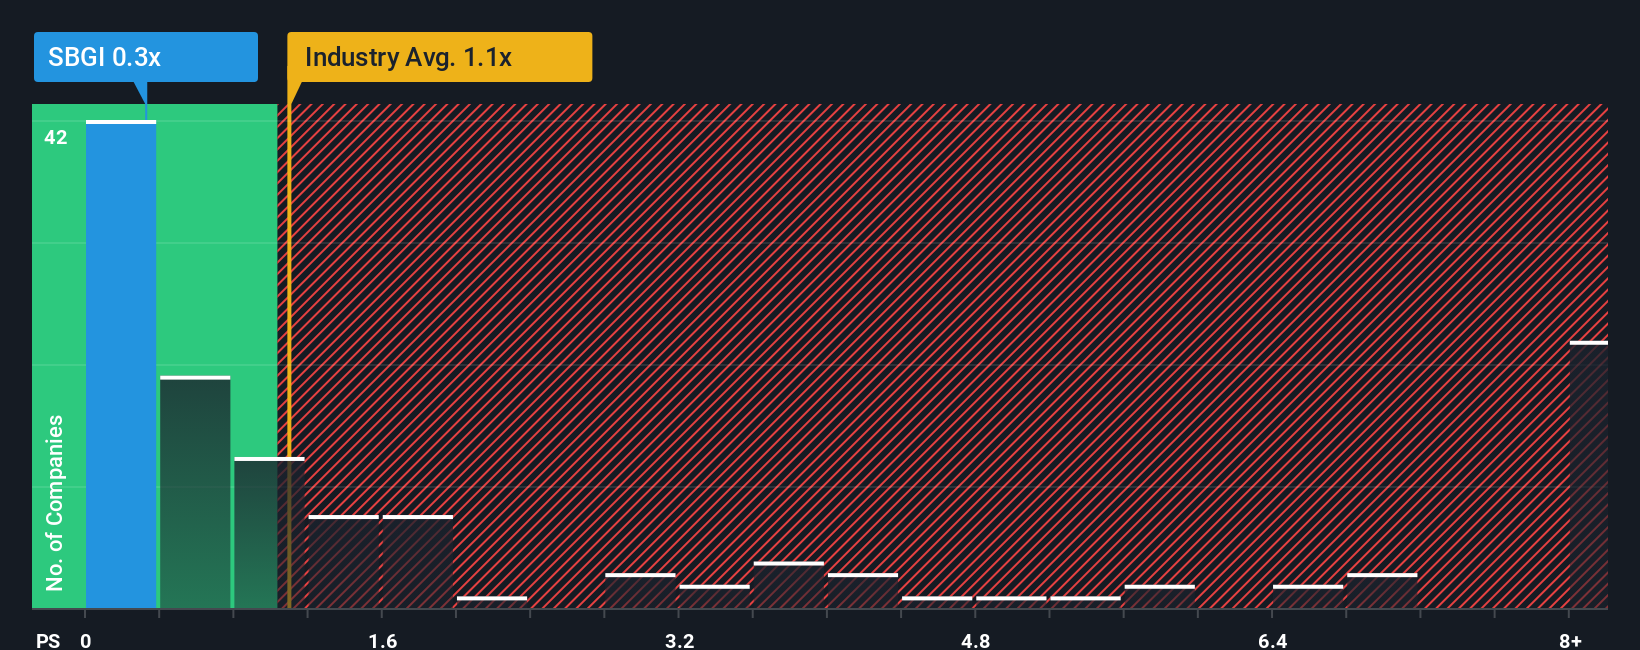
Sinclair currently trades on a P/S of 0.31x. That sits below the Media industry average P/S of 0.88x and below the peer group average of 1.31x, so the market is pricing Sinclair’s sales at a discount to many competitors.
Simply Wall St’s Fair Ratio for Sinclair is 0.71x. This is a proprietary estimate of what P/S might be reasonable given factors such as earnings growth, profit margins, industry, market cap and company specific risks. Because it is tailored to Sinclair rather than broad groups, it can be more informative than just comparing the stock with industry or peer averages.
Comparing the Fair Ratio of 0.71x with the current 0.31x indicates that the shares appear undervalued on this measure.
Result: UNDERVALUED
P/S ratios tell one story, but what if the real opportunity lies elsewhere? Start investing in legacies, not executives. Discover our 23 top founder-led companies.
Upgrade Your Decision Making: Choose your Sinclair Narrative
Earlier we mentioned that there is an even better way to understand valuation, so let us introduce you to Narratives, where you spell out your story for Sinclair, link that story to specific revenue, earnings and margin assumptions, and see how it flows through to a fair value that sits right next to today’s price, all within the Simply Wall St Community page used by millions of investors.
A Narrative is your explanation of what you think is really happening at Sinclair, written out in plain language and tied directly to a financial forecast. Instead of just accepting a single fair value, you can see how your assumptions would justify, for example, a lower fair value closer to US$11.00 or a higher one around US$26.88, then compare both against the current share price to help you decide whether the stock appears expensive or cheap on your terms.
Because Narratives on the platform update automatically when new information such as earnings or news on Sinclair’s 8.2% stake in E.W. Scripps appears, you are not locked into a one off view. You can refine your story over time and see in real time how changes in expected revenue, margins, P/E or discount rate shift your fair value and, in turn, your decision about whether holding, adding or reducing makes sense for you.
For Sinclair however we will make it really easy for you with previews of two leading Sinclair Narratives:
Fair value in this bullish narrative is set at US$26.88 per share.
At a last close of US$14.96, that is about 44.3% below this narrative fair value based on ((26.88 - 14.96) / 26.88).
The revenue growth input in this narrative is a 1.9% annual decline.
- The optimistic case leans on digital expansion, data services and ad tech to support higher margins and a stronger long term earnings profile than analysts currently factor in.
- It assumes earnings could rise to about US$332.3 million by around September 2028 with profit margins broadly in line with the wider US Media industry and a future P/E of 9.2x.
- Key risks include pressure on traditional TV revenues, advertising headwinds, high leverage around 5.7x and ongoing regulatory scrutiny that could affect both cash flows and valuation.
Fair value in this bearish narrative is set at US$11.00 per share.
At a last close of US$14.96, that is about 36.0% above this narrative fair value based on ((14.96 - 11.00) / 11.00).
The narrative uses a revenue growth input of 50.1% a year.
- The cautious case focuses on pressure on core broadcast ad revenues, cord cutting and audience fragmentation, which together reduce the value of Sinclair’s distribution assets.
- It assumes earnings could reach about US$313.1 million by around September 2028, but supports a much lower future P/E of 3.1x, which pulls fair value down to around US$11.00.
- This narrative highlights debt and regulatory risk, questions around retransmission fees and the possibility that capital tied up in moves like the 8.2% E.W. Scripps stake may not earn an attractive return.
If you want to see how other investors are framing these kinds of trade offs in detail, you can step through the full bull and bear narratives for Sinclair inside the Community and compare them side by side with your own assumptions.
Do you think there's more to the story for Sinclair? Head over to our Community to see what others are saying!

This article by Simply Wall St is general in nature. We provide commentary based on historical data and analyst forecasts only using an unbiased methodology and our articles are not intended to be financial advice. It does not constitute a recommendation to buy or sell any stock, and does not take account of your objectives, or your financial situation. We aim to bring you long-term focused analysis driven by fundamental data. Note that our analysis may not factor in the latest price-sensitive company announcements or qualitative material. Simply Wall St has no position in any stocks mentioned.
New: Manage All Your Stock Portfolios in One Place
We've created the ultimate portfolio companion for stock investors, and it's free.
• Connect an unlimited number of Portfolios and see your total in one currency
• Be alerted to new Warning Signs or Risks via email or mobile
• Track the Fair Value of your stocks
Have feedback on this article? Concerned about the content? Get in touch with us directly. Alternatively, email editorial-team@simplywallst.com
About NasdaqGS:SBGI
Sinclair
A media company, provides content on local television stations and digital platforms in the United States.
Medium-low risk established dividend payer.
Similar Companies
Market Insights


Advertisement
Weekly Picks
LO


Lou_Basenese on Cue Biopharma ·
Cue Biopharma (NASDAQ: CUE): The Scientist Behind Xolair Just Gave Cue a Next-Generation Shot at the Same Multi-Billion-Dollar Market
Fair Value:US$7057.9% undervalued
18 followersusers have followed this narrative
0 commentsusers have commented on this narrative
5 likesusers have liked this narrative
HE


HedgeY on AST SpaceMobile ·
AST SpaceMobile: The Boldest Direct-to-Cell Bet in Public Markets
Fair Value:US$17044.9% undervalued
36 followersusers have followed this narrative
0 commentsusers have commented on this narrative
12 likesusers have liked this narrative
FU

FundamentalFlow on Onto Innovation ·
Onto Innovation: The Advanced Packaging Chokepoint 51.3% undervalued intrinsic discount
Fair Value:US$38033.4% undervalued
26 followersusers have followed this narrative
0 commentsusers have commented on this narrative
6 likesusers have liked this narrative
MA


martinarauz on Nu Holdings ·
Investment Analysis (May 2026)
Fair Value:US$22.7447.4% undervalued
58 followersusers have followed this narrative
0 commentsusers have commented on this narrative
15 likesusers have liked this narrative
Recently Updated Narratives
QU


QuanD on Space Exploration Technologies ·
Making sense of 1.75 trillion IPO
Fair Value:US$1350% overvalued
1 followerusers have followed this narrative
0 commentsusers have commented on this narrative
0 likesusers have liked this narrative
MA
Marek_Trnka on Space Exploration Technologies ·
SpaceX? Only Fast in - Fast out!
Fair Value:US$1350% overvalued
5 followersusers have followed this narrative
0 commentsusers have commented on this narrative
0 likesusers have liked this narrative
HA


Harshvardhan on Indian Oil ·
INDIAN OIL CORPORATION IS THE TITAN IN TRANSITION
Fair Value:₹21435.4% undervalued
1 followerusers have followed this narrative
0 commentsusers have commented on this narrative
0 likesusers have liked this narrative
Popular Narratives
MA
martinarauz on Nu Holdings ·
Investment Analysis (May 2026)
Fair Value:US$22.7447.4% undervalued
58 followersusers have followed this narrative
0 commentsusers have commented on this narrative
15 likesusers have liked this narrative
CL


Clive_Thompson on Take-Two Interactive Software ·
Take-Two Interactive: The Calm Before the Storm NASDAQ: TTWO Last Price: $242.41 Date: May 15, 2026
Fair Value:US$276.9722.6% undervalued
57 followersusers have followed this narrative
0 commentsusers have commented on this narrative
14 likesusers have liked this narrative
NI

niteco on Honeywell International ·
Honeywell - The Demand-Side of the AI Infrastructure
Fair Value:US$320.1933.2% undervalued
48 followersusers have followed this narrative
0 commentsusers have commented on this narrative
19 likesusers have liked this narrative
Trending Discussion
SI

Simply Wall St User on Access Holdings ·
It's wonderful. It has greatly helped me take informed decisions.
0
|0
CO


composite32 on Ronesans Gayrimenkul Yatirim ·
Selamlar Teşekkürler.. Radarımda olan bir şirket değil, Halka açıklık oranı %40'ın üzerinde olan şir...
0
|0
