- United States
- /
- Interactive Media and Services
- /
- NasdaqGS:GOOGL
Alphabet (NASDAQ:GOOGL) Seems To Use Debt Rather Sparingly

Legendary fund manager Li Lu (who Charlie Munger backed) once said, 'The biggest investment risk is not the volatility of prices, but whether you will suffer a permanent loss of capital.' It's only natural to consider a company's balance sheet when you examine how risky it is, since debt is often involved when a business collapses. We note that Alphabet Inc. (NASDAQ:GOOGL) does have debt on its balance sheet. But is this debt a concern to shareholders?
Why Does Debt Bring Risk?
Debt and other liabilities become risky for a business when it cannot easily fulfill those obligations, either with free cash flow or by raising capital at an attractive price. If things get really bad, the lenders can take control of the business. However, a more usual (but still expensive) situation is where a company must dilute shareholders at a cheap share price simply to get debt under control. Of course, the upside of debt is that it often represents cheap capital, especially when it replaces dilution in a company with the ability to reinvest at high rates of return. When we examine debt levels, we first consider both cash and debt levels, together.
Check out our latest analysis for Alphabet
How Much Debt Does Alphabet Carry?
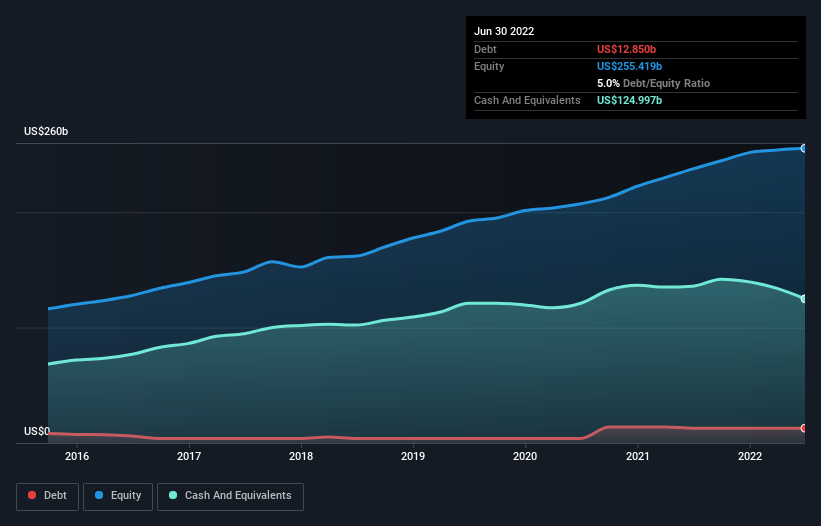
The chart below, which you can click on for greater detail, shows that Alphabet had US$12.9b in debt in June 2022; about the same as the year before. But on the other hand it also has US$125.0b in cash, leading to a US$112.1b net cash position.
How Healthy Is Alphabet's Balance Sheet?
Zooming in on the latest balance sheet data, we can see that Alphabet had liabilities of US$61.4b due within 12 months and liabilities of US$38.4b due beyond that. On the other hand, it had cash of US$125.0b and US$37.1b worth of receivables due within a year. So it can boast US$62.3b more liquid assets than total liabilities.
This short term liquidity is a sign that Alphabet could probably pay off its debt with ease, as its balance sheet is far from stretched. Succinctly put, Alphabet boasts net cash, so it's fair to say it does not have a heavy debt load!
On top of that, Alphabet grew its EBIT by 32% over the last twelve months, and that growth will make it easier to handle its debt. The balance sheet is clearly the area to focus on when you are analysing debt. But ultimately the future profitability of the business will decide if Alphabet can strengthen its balance sheet over time. So if you want to see what the professionals think, you might find this free report on analyst profit forecasts to be interesting.
Finally, a company can only pay off debt with cold hard cash, not accounting profits. While Alphabet has net cash on its balance sheet, it's still worth taking a look at its ability to convert earnings before interest and tax (EBIT) to free cash flow, to help us understand how quickly it is building (or eroding) that cash balance. During the last three years, Alphabet generated free cash flow amounting to a very robust 87% of its EBIT, more than we'd expect. That puts it in a very strong position to pay down debt.
Summing Up
While it is always sensible to investigate a company's debt, in this case Alphabet has US$112.1b in net cash and a decent-looking balance sheet. And it impressed us with free cash flow of US$65b, being 87% of its EBIT. So we don't think Alphabet's use of debt is risky. Over time, share prices tend to follow earnings per share, so if you're interested in Alphabet, you may well want to click here to check an interactive graph of its earnings per share history.
When all is said and done, sometimes its easier to focus on companies that don't even need debt. Readers can access a list of growth stocks with zero net debt 100% free, right now.
New: Manage All Your Stock Portfolios in One Place
We've created the ultimate portfolio companion for stock investors, and it's free.
• Connect an unlimited number of Portfolios and see your total in one currency
• Be alerted to new Warning Signs or Risks via email or mobile
• Track the Fair Value of your stocks
Have feedback on this article? Concerned about the content? Get in touch with us directly. Alternatively, email editorial-team (at) simplywallst.com.
This article by Simply Wall St is general in nature. We provide commentary based on historical data and analyst forecasts only using an unbiased methodology and our articles are not intended to be financial advice. It does not constitute a recommendation to buy or sell any stock, and does not take account of your objectives, or your financial situation. We aim to bring you long-term focused analysis driven by fundamental data. Note that our analysis may not factor in the latest price-sensitive company announcements or qualitative material. Simply Wall St has no position in any stocks mentioned.
About NasdaqGS:GOOGL
Alphabet
Offers various products and platforms in the United States, Europe, the Middle East, Africa, the Asia-Pacific, Canada, and Latin America.
Very undervalued with outstanding track record.
Similar Companies
Market Insights

Community Narratives

