Advertisement
- United States
- /
- Telecom Services and Carriers
- /
- NasdaqGS:CMCSA
Does Comcast’s 2025 Valuation Reflect Its DCF Upside and Recent Share Price Rebound?

Reviewed by Bailey Pemberton
- If you are wondering whether Comcast is quietly turning into a value opportunity while many investors focus on flashier tech names, this article will walk you through whether the current price actually makes sense.
- Over the last week Comcast is up 3.7%, and it has gained 6.9% over the past month, but those short term bumps still sit on top of a much rougher backdrop, with the stock down 21.9% year to date and 20.1% over the last year.
- Recently, Comcast has stayed in the headlines for its continued broadband and wireless subscriber momentum, along with ongoing investment in its theme parks and streaming offerings. All of these factors influence how investors think about its long term cash flows. At the same time, competitive pressures in cable, streaming, and advertising, plus shifting consumer behavior, are shaping the narrative around whether its legacy businesses can keep funding growth initiatives.
- Despite that mixed story, our valuation work gives Comcast a 5/6 valuation score. This suggests the market may be underestimating its fundamentals. Next, we will break that down with multiple approaches to valuation, while hinting at an additional way to think about what the stock may really be worth by the end of this article.
Find out why Comcast's -20.1% return over the last year is lagging behind its peers.
Approach 1: Comcast Discounted Cash Flow (DCF) Analysis
A Discounted Cash Flow, or DCF, model estimates what a company is worth today by projecting its future cash flows and discounting them back to a present value. For Comcast, the model uses a 2 stage Free Cash Flow to Equity approach, based on its ability to generate cash for shareholders over time.
Comcast currently produces trailing twelve month free cash flow of about $17.6 billion, a substantial base from which analysts and extrapolated estimates project modest growth. Analyst forecasts extend several years ahead, after which Simply Wall St extrapolates free cash flows, with projections reaching roughly $18.4 billion by 2035 as cash generation edges higher over time.
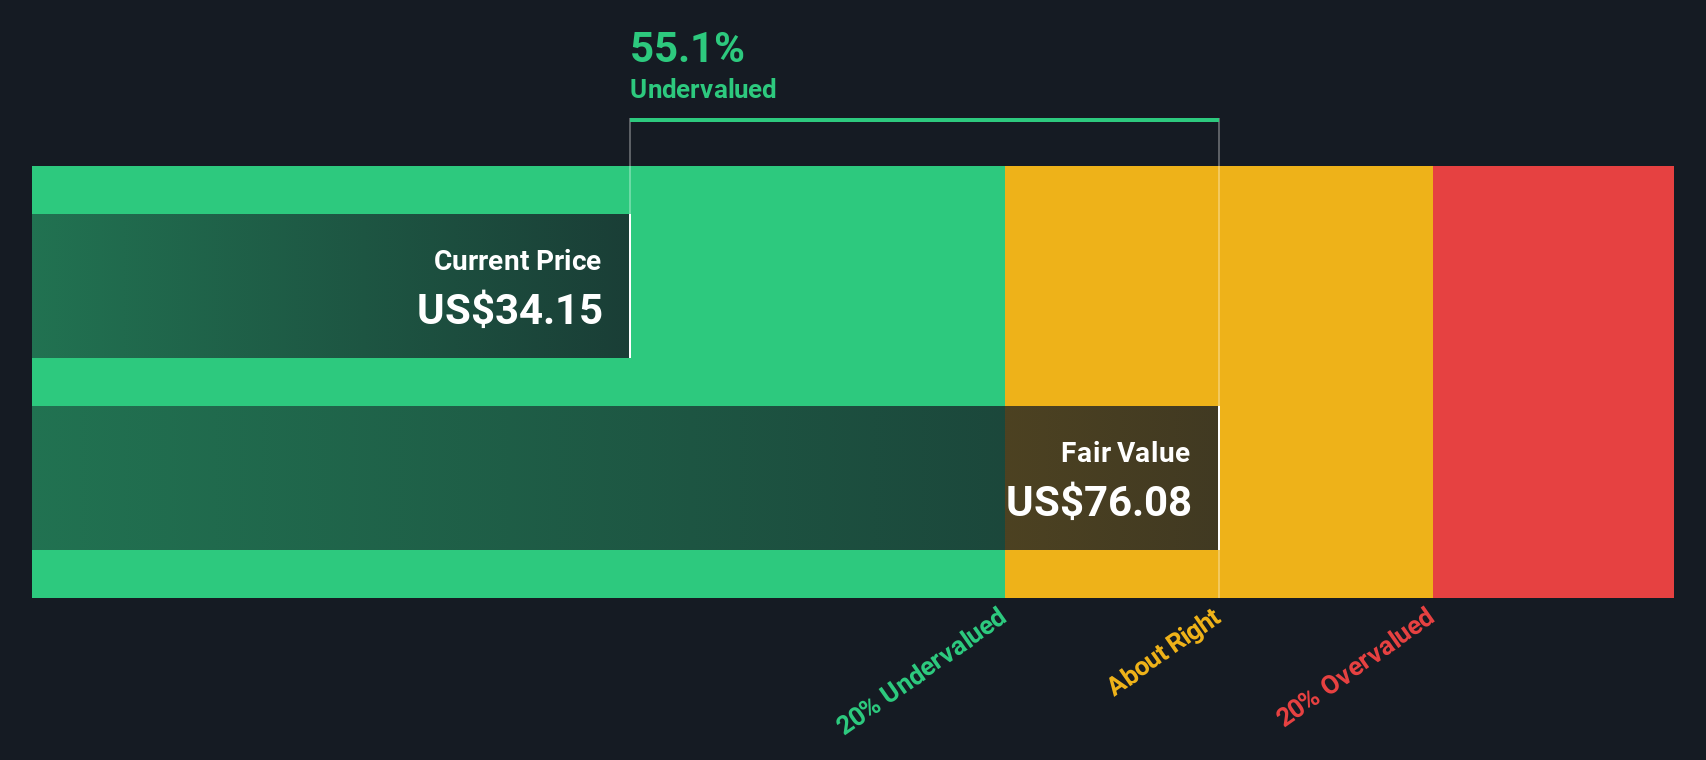
When those projected cash flows are discounted back to today, the DCF model used in this analysis suggests an intrinsic value of about $82.09 per share. Compared with the current market price, this implies roughly a 64.4% discount, indicating that, under these assumptions, investors are pricing Comcast well below the value implied by its projected cash generation.
Result: UNDERVALUED (based on this DCF model)
Our Discounted Cash Flow (DCF) analysis suggests Comcast is undervalued by 64.4%. Track this in your watchlist or portfolio, or discover 898 more undervalued stocks based on cash flows.
Approach 2: Comcast Price vs Earnings
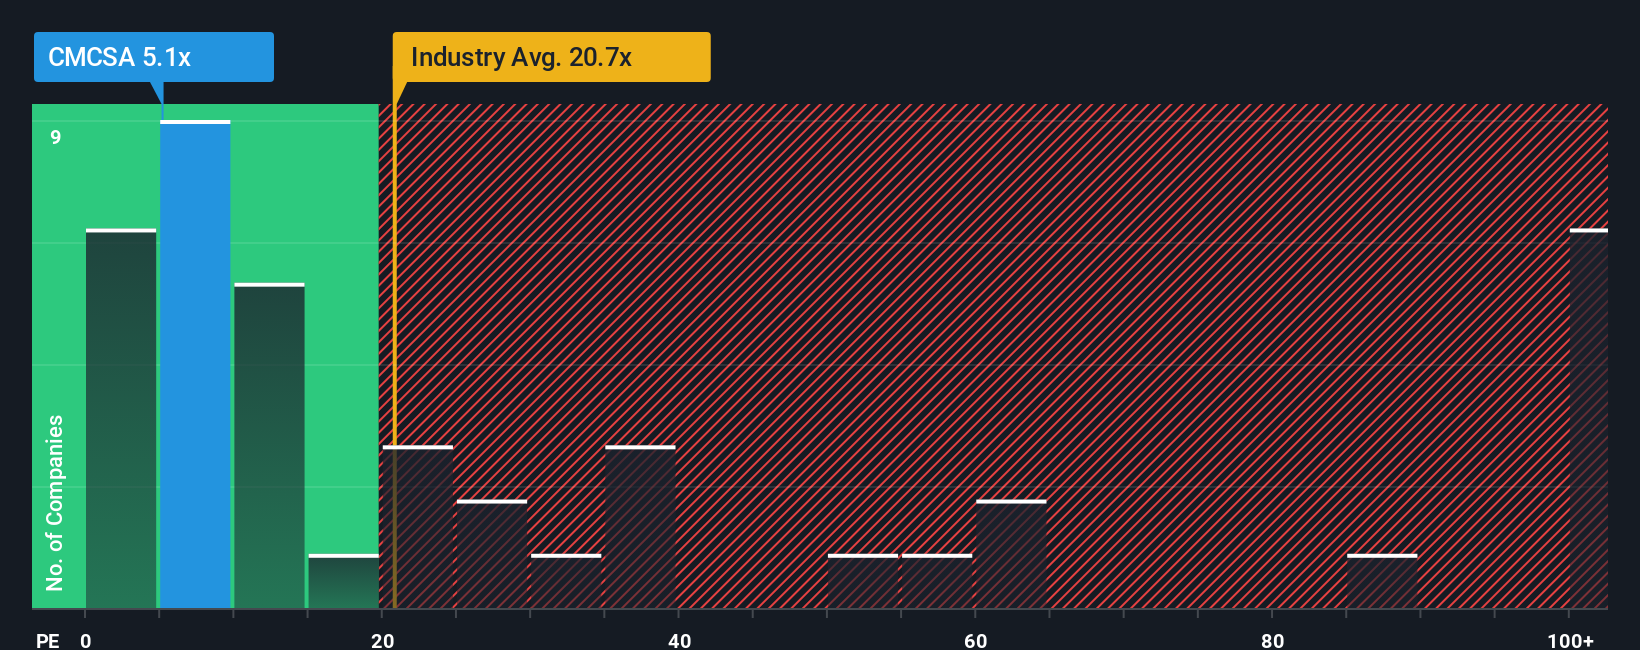
For a mature, consistently profitable business like Comcast, the Price to Earnings (PE) ratio is a useful way to gauge whether investors are paying a reasonable price for each dollar of current earnings. In general, faster growing and lower risk companies tend to justify higher PE ratios, while slower growth or higher risk stories deserve lower multiples.
Comcast currently trades at around 4.7x earnings, which is far below both the media industry average of about 16.0x and the broader peer group average near 34.3x. On the surface, that discount suggests the market is heavily penalizing Comcast relative to other media names, despite its solid profitability and scale.
Simply Wall St uses a proprietary Fair Ratio to go a step further. For Comcast, that Fair PE Ratio is estimated at roughly 15.5x, based on its earnings growth outlook, margins, risk profile, industry, and market cap. This is more informative than a simple peer or industry comparison because it adjusts for the company’s own fundamentals rather than assuming it should trade exactly like its competitors. With the current PE at 4.7x versus a Fair Ratio of 15.5x, Comcast screens as materially undervalued on this metric.
Result: UNDERVALUED
PE ratios tell one story, but what if the real opportunity lies elsewhere? Discover 1457 companies where insiders are betting big on explosive growth.
Upgrade Your Decision Making: Choose your Comcast Narrative
Earlier we mentioned that there is an even better way to understand valuation, so let us introduce you to Narratives, a simple way to connect your view of Comcast’s story to a set of numbers and a fair value estimate. A Narrative is your structured perspective on the company, where you spell out what you believe about its future revenue, earnings and margins, and then link that story to a financial forecast and, ultimately, a fair value per share. On Simply Wall St, Narratives live inside the Community page and are designed to be easy to use, so millions of investors can compare their own Fair Value to the current share price and decide whether Comcast looks like a buy, a hold, or a sell. Because Narratives update dynamically when new information like earnings, news or guidance drops, they stay aligned with reality instead of going stale. For Comcast, one Narrative might lean toward a lower fair value around 28 dollars if you think broadband and media headwinds will bite harder, while another might support a higher fair value near 49 dollars if you believe investments in parks, streaming and next gen broadband will pay off more strongly.
For Comcast, however, we will make it really easy for you with previews of two leading Comcast Narratives:
Fair value: $34.65 per share
Implied undervaluation vs last close: approximately 15.6%
Forecast revenue growth: 1.53%
- Assumes broadband innovation, streaming scale at Peacock, and expansion of Universal theme parks together support resilient earnings, cash flow visibility, and ongoing capital returns.
- Builds in modest top line growth with margin compression, yet still expects the market to rerate Comcast toward a higher future PE multiple than today, though below the broader US media industry.
- Anchors on an analyst consensus target of $39.75, arguing that, even with slower earnings and rising costs, the current price underestimates Comcast's long term cash generation and strategic assets.
Fair value: $28.00 per share
Implied overvaluation vs last close: approximately 4.4%
Forecast revenue growth: 0.69%
- Emphasizes saturated broadband markets, cord cutting, digital ad shifts, and fierce competition as structural headwinds that could weigh on Comcast's largest profit pools for years.
- Highlights rising content and sports rights costs, heavy capex, and regulatory risks as forces that may compress margins, constrain free cash flow, and limit the scope for buybacks and dividend growth.
- Aligns with the most cautious analyst cohort, using a $28 fair value and low revenue growth assumptions to suggest that, from current levels, downside risk may outweigh upside unless execution materially improves.
Do you think there's more to the story for Comcast? Head over to our Community to see what others are saying!

This article by Simply Wall St is general in nature. We provide commentary based on historical data and analyst forecasts only using an unbiased methodology and our articles are not intended to be financial advice. It does not constitute a recommendation to buy or sell any stock, and does not take account of your objectives, or your financial situation. We aim to bring you long-term focused analysis driven by fundamental data. Note that our analysis may not factor in the latest price-sensitive company announcements or qualitative material. Simply Wall St has no position in any stocks mentioned.
New: AI Stock Screener & Alerts
Our new AI Stock Screener scans the market every day to uncover opportunities.
• Dividend Powerhouses (3%+ Yield)
• Undervalued Small Caps with Insider Buying
• High growth Tech and AI Companies
Or build your own from over 50 metrics.
Have feedback on this article? Concerned about the content? Get in touch with us directly. Alternatively, email editorial-team@simplywallst.com
About NasdaqGS:CMCSA
Comcast
Operates as a media and technology company worldwide.
6 star dividend payer and undervalued.
Similar Companies
Market Insights


Advertisement
Weekly Picks
LO


Lou_Basenese on Virtuix Holdings ·
From a “Shark Tank” Snub to an Air Force “Yes”: Why Virtuix at $3.50 May Be the Market’s Most Mispriced AI Story
Fair Value:US$7.559.3% undervalued
31 followersusers have followed this narrative
0 commentsusers have commented on this narrative
6 likesusers have liked this narrative
HE


HedgeY on IonQ ·
The Best-Funded Quantum Platform and Still a Stock Priced for Perfection
Fair Value:US$4811.0% overvalued
3 followersusers have followed this narrative
0 commentsusers have commented on this narrative
0 likesusers have liked this narrative
BL


BlackGoat on Cerebras Systems ·
The Wafer Giant Threatening NVIDIA's GPU Hegemony
Fair Value:US$415.5446.8% undervalued
9 followersusers have followed this narrative
1 commentusers have commented on this narrative
5 likesusers have liked this narrative
IV

Ivoed on Netflix ·
Netflix’s Business Quality Is Clear. The Harder Question Is Whether The Stock Is Still Cheap
Fair Value:US$8212.9% undervalued
5 followersusers have followed this narrative
0 commentsusers have commented on this narrative
2 likesusers have liked this narrative
Recently Updated Narratives
AN


andre_santos on NIKE ·
Nike - A Fundamental and Historical Valuation
Fair Value:US$36.8311.5% overvalued
10 followersusers have followed this narrative
0 commentsusers have commented on this narrative
0 likesusers have liked this narrative
TR


TripleS on AnaptysBio ·
ANAB has a scaling and rising royalty stream, one up and coming new royalty, a loan that dies in 2027 which will result in a doubling
Fair Value:US$9025.0% undervalued
1 followerusers have followed this narrative
0 commentsusers have commented on this narrative
0 likesusers have liked this narrative
GE
Germaine on MM Computer Systems Berhad ·
MM Computer Systems' Latest Contract Wins Reinforce Growth Momentum After Listing
Fair Value:RM 0.3313.6% undervalued
1 followerusers have followed this narrative
0 commentsusers have commented on this narrative
0 likesusers have liked this narrative
Popular Narratives
IN


Investingwilly on Mastercard ·
Mastercard: The Best Dividend Stock You're Ignoring
Fair Value:US$75031.5% undervalued
79 followersusers have followed this narrative
1 commentusers have commented on this narrative
9 likesusers have liked this narrative
HA


HarishPK on Adobe ·
Adobe: A Probabilistic Case for Undervaluation
Fair Value:US$319.9635.9% undervalued
62 followersusers have followed this narrative
9 commentsusers have commented on this narrative
19 likesusers have liked this narrative
MA


martinarauz on Nu Holdings ·
Investment Analysis (May 2026)
Fair Value:US$22.7441.2% undervalued
68 followersusers have followed this narrative
0 commentsusers have commented on this narrative
17 likesusers have liked this narrative

