
Advertisement
- United States
- /
- Chemicals
- /
- NYSEAM:FSI
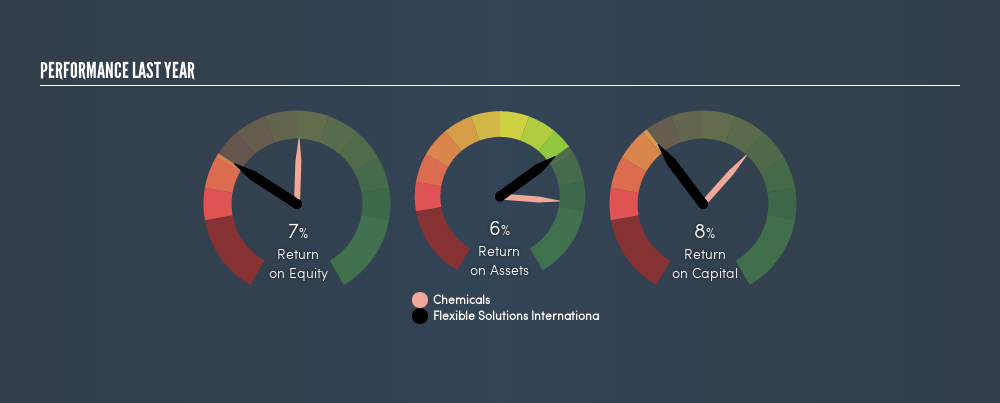
Examining Flexible Solutions International Inc.’s (NYSEMKT:FSI) Weak Return On Capital Employed

Today we'll evaluate Flexible Solutions International Inc. (NYSEMKT:FSI) to determine whether it could have potential as an investment idea. Specifically, we'll consider its Return On Capital Employed (ROCE), since that will give us an insight into how efficiently the business can generate profits from the capital it requires.
First of all, we'll work out how to calculate ROCE. Then we'll compare its ROCE to similar companies. And finally, we'll look at how its current liabilities are impacting its ROCE.
Understanding Return On Capital Employed (ROCE)
ROCE is a measure of a company's yearly pre-tax profit (its return), relative to the capital employed in the business. Generally speaking a higher ROCE is better. In brief, it is a useful tool, but it is not without drawbacks. Renowned investment researcher Michael Mauboussin has suggested that a high ROCE can indicate that 'one dollar invested in the company generates value of more than one dollar'.
How Do You Calculate Return On Capital Employed?
Analysts use this formula to calculate return on capital employed:
Return on Capital Employed = Earnings Before Interest and Tax (EBIT) ÷ (Total Assets - Current Liabilities)
Or for Flexible Solutions International:
0.076 = US$1.3m ÷ (US$20m - US$2.2m) (Based on the trailing twelve months to September 2018.)
Therefore, Flexible Solutions International has an ROCE of 7.6%.
View our latest analysis for Flexible Solutions International
Is Flexible Solutions International's ROCE Good?
When making comparisons between similar businesses, investors may find ROCE useful. We can see Flexible Solutions International's ROCE is meaningfully below the Chemicals industry average of 12%. This performance could be negative if sustained, as it suggests the business may underperform its industry. Separate from how Flexible Solutions International stacks up against its industry, its ROCE in absolute terms is mediocre; relative to the returns on government bonds. Investors may wish to consider higher-performing investments.
As we can see, Flexible Solutions International currently has an ROCE of 7.6%, less than the 17% it reported 3 years ago. This makes us wonder if the business is facing new challenges.
Remember that this metric is backwards looking - it shows what has happened in the past, and does not accurately predict the future. ROCE can be deceptive for cyclical businesses, as returns can look incredible in boom times, and terribly low in downturns. ROCE is, after all, simply a snap shot of a single year. Since the future is so important for investors, you should check out our freereport on analyst forecasts for Flexible Solutions International.
Do Flexible Solutions International's Current Liabilities Skew Its ROCE?
Current liabilities are short term bills and invoices that need to be paid in 12 months or less. Due to the way the ROCE equation works, having large bills due in the near term can make it look as though a company has less capital employed, and thus a higher ROCE than usual. To counteract this, we check if a company has high current liabilities, relative to its total assets.
Flexible Solutions International has total assets of US$20m and current liabilities of US$2.2m. As a result, its current liabilities are equal to approximately 11% of its total assets. This is a modest level of current liabilities, which would only have a small effect on ROCE.
What We Can Learn From Flexible Solutions International's ROCE
If Flexible Solutions International continues to earn an uninspiring ROCE, there may be better places to invest. Of course, you might find a fantastic investment by looking at a few good candidates. So take a peek at this freelist of companies with modest (or no) debt, trading on a P/E below 20.
For those who like to find winning investments this freelist of growing companies with recent insider purchasing, could be just the ticket.
We aim to bring you long-term focused research analysis driven by fundamental data. Note that our analysis may not factor in the latest price-sensitive company announcements or qualitative material.
If you spot an error that warrants correction, please contact the editor at editorial-team@simplywallst.com. This article by Simply Wall St is general in nature. It does not constitute a recommendation to buy or sell any stock, and does not take account of your objectives, or your financial situation. Simply Wall St has no position in the stocks mentioned. Thank you for reading.
About NYSEAM:FSI
Flexible Solutions International
Develops, manufactures, and markets specialty chemicals that slow the evaporation of water in Canada, the United States, and internationally.
Flawless balance sheet with high growth potential.
Similar Companies
Market Insights


Advertisement
Community Narratives
The Future of Drug Testing? Fingerprint Tech Shows Serious Promise
Fair Value US$2.98|40.3% undervalued
JO
Community Contributor
Suncorp’s Next Chapter: Insurance-Only and Ready to Grow
Fair Value AU$22.83|7.6% undervalued
RO
Community Contributor
Thyssenkrupp Nucera Will Achieve Double-Digit Profits by 2030 Boosted by Hydrogen Growth
Fair Value €14.40|31.6% undervalued
CH
Community Contributor
Tesla’s Nvidia Moment – The AI & Robotics Inflection Point
Fair Value US$359.72|12.3% undervalued
BL
Community Contributor