Advertisement
- United States
- /
- Chemicals
- /
- NYSE:SCL
Is Stepan at a Turning Point After 38% Share Price Drop in 2024?

Simply Wall St
Reviewed by Bailey Pemberton
If you are sitting on the fence about what to do with your Stepan shares, you are not alone. After a sharp, sustained decline, the stock is catching the eye of both bargain hunters and cautious investors wondering if things could fall further. Stepan’s share price has dropped almost 27% since the start of the year, and it is down nearly 38% in the past twelve months. Over the last three years, the stock has shed close to half its value, underscoring the fact that long-term holders have felt the pain of a shifting industry landscape and shifting risk perceptions. Lately, broader market fluctuations have only added to that volatility, and Stepan’s price remained under pressure again with a recent 3.9% slide this past week.
With all these price moves, the key question becomes whether Stepan is being overly punished or if there’s something deeper at play that justifies the current valuation. That is where it starts to get interesting. When scored for value across six major checks, Stepan lands a solid 5 out of 6 on our valuation scale, putting it firmly in undervalued territory. What does that really mean? Are all value scores created equal? In the next section, we will break down each approach to valuation and reveal why looking at the bigger picture can lead to better decisions.
Why Stepan is lagging behind its peers
Approach 1: Stepan Discounted Cash Flow (DCF) Analysis
The Discounted Cash Flow (DCF) model is a widely used technique for estimating a company's intrinsic value by projecting its future cash flows and then bringing those figures back to the present using a suitable discount rate. It aims to determine how much the business is worth based on its ability to generate cash in the years ahead.
For Stepan, the current Free Cash Flow stands at a negative $87.86 million. Despite this challenging start, analysts expect the cash flows to rebound and grow significantly. Projections supplied by analysts extend five years forward. Figures beyond that are extrapolated by Simply Wall St. According to these estimates, Free Cash Flow is expected to reach $160.5 million by 2029 and continue climbing over the next decade, suggesting optimism about future earnings power.
Applying the DCF method, the estimated intrinsic value per Stepan share comes in at $113.18. With the share currently trading at a substantial discount, the DCF analysis suggests the stock is 59.2% undervalued based on future cash flow expectations and the company's potential to recover.
Result: UNDERVALUED
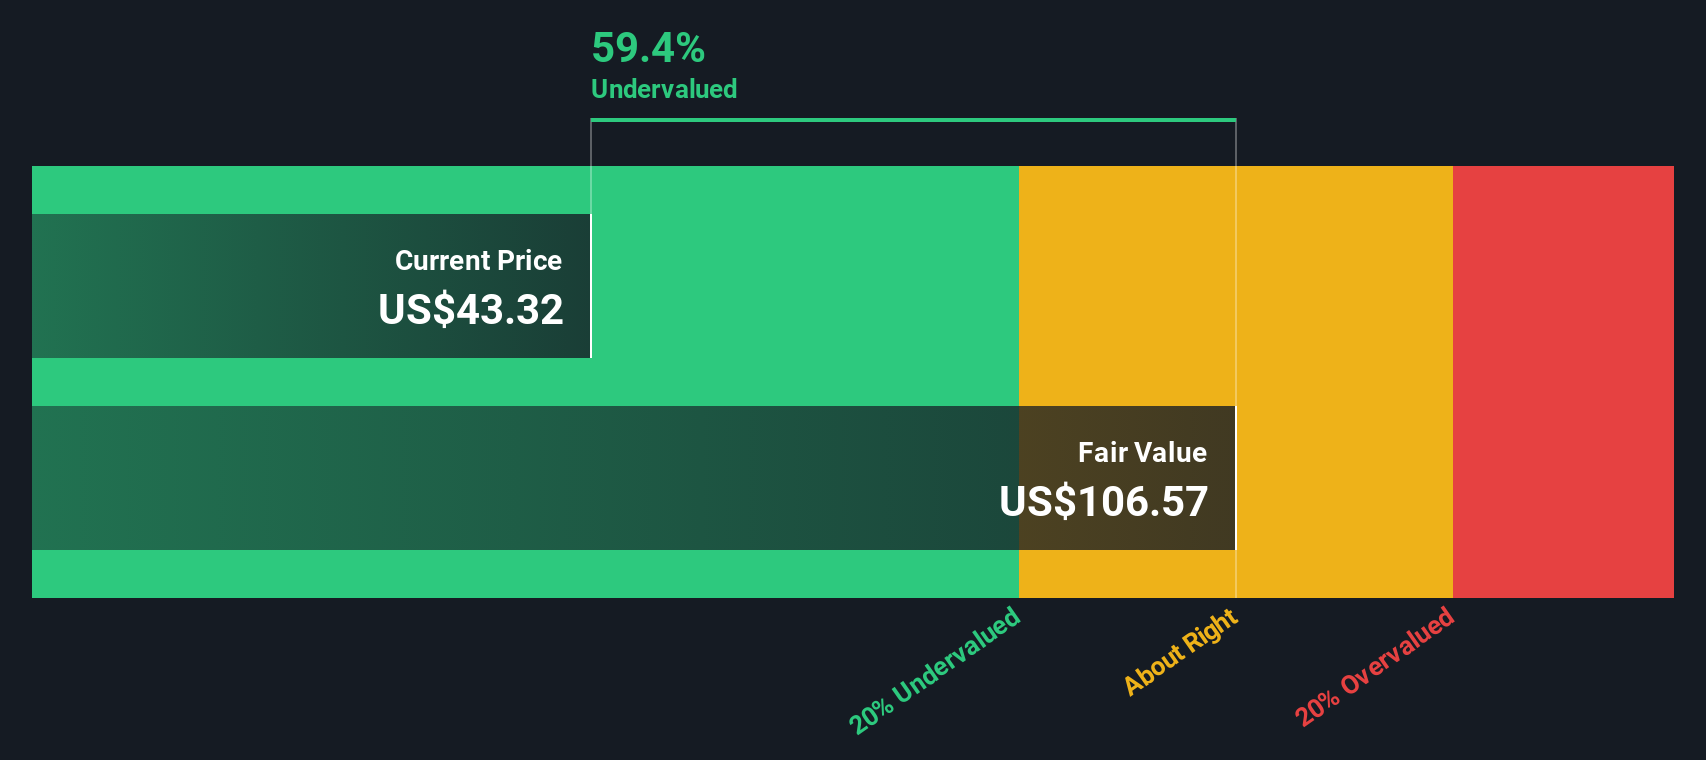
Our Discounted Cash Flow (DCF) analysis suggests Stepan is undervalued by 59.2%. Track this in your watchlist or portfolio, or discover more undervalued stocks.
Approach 2: Stepan Price vs Earnings (PE)
For profitable companies like Stepan, the Price-to-Earnings (PE) ratio is often considered the go-to metric because it directly reflects how much investors are willing to pay for each dollar of earnings. It’s a simple, widely-followed snapshot that helps investors compare valuation across different companies and industries.
A company’s “normal” or “fair” PE ratio depends heavily on its expected growth rate and risk profile. Rapidly growing companies or those considered to have stable earnings and lower risk typically trade at higher PE multiples, while riskier or slower-growing firms show lower PEs. Simply put, the PE ratio you’re willing to pay comes down to how bright the future looks and how certain those gains appear.
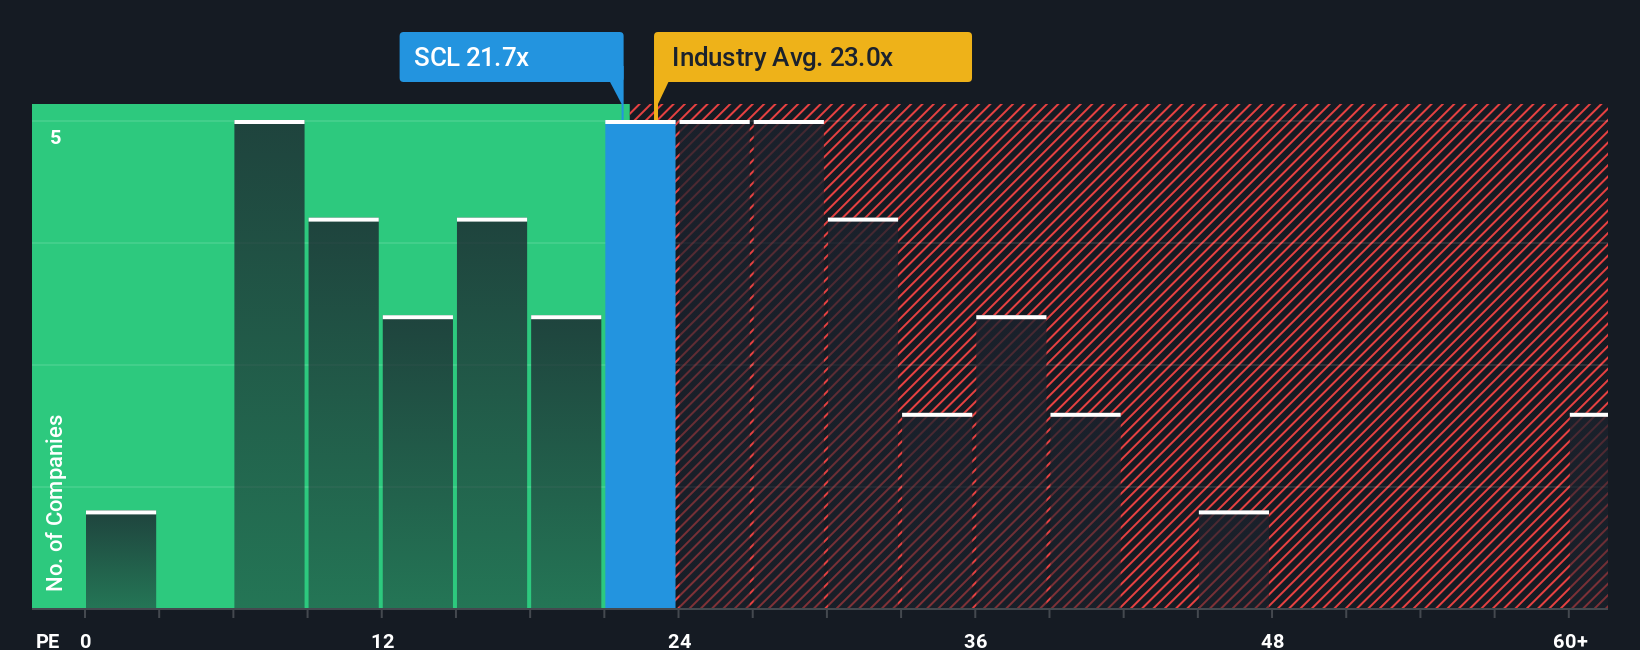
Stepan’s current PE ratio stands at 18x. This is well below the Chemicals industry average of 26.6x and the peer average of 37.8x, hinting at a valuation discount. But is this discount justified or is it an opportunity? That’s where the Simply Wall St “Fair Ratio” comes in. It considers more than simple averages, factoring in things like Stepan’s specific growth outlook, profit margins, market capitalization, and risk factors to determine a more nuanced target multiple. According to this model, Stepan’s Fair PE Ratio is 24.4x. This suggests that while the company is being valued conservatively by the market, it is trading at a sizeable discount compared to where it should be based on fundamentals.
Result: UNDERVALUED
PE ratios tell one story, but what if the real opportunity lies elsewhere? Discover companies where insiders are betting big on explosive growth.
Upgrade Your Decision Making: Choose your Stepan Narrative
Earlier, we hinted at a smarter way to make sense of valuation, so let's introduce you to Narratives, a feature that lets you craft your own perspective on Stepan by connecting its business story to real financial forecasts, all the way to a fair value per share.
A Narrative is simply your interpretation of where the business is headed, captured in assumptions about revenue, earnings, and margins. You can easily create and compare these on Simply Wall St's Community page without any technical expertise.
This tool empowers millions of investors to link their views on catalysts or risks with updated forecasts, instantly turning their story into a clear estimate of what the stock should be worth today.
Narratives make buy or sell decisions far more actionable. You see your calculated Fair Value versus the current market price, and Narratives automatically adjust whenever new news or earnings reports are released, so you are always working with the latest information.
For example, on Stepan, one investor may see growth from new technology and the Texas site pushing fair value as high as $113 per share, while another might focus on margin pressures and project a fair value closer to $82. This illustrates how different stories lead to different numbers and helps you find your own conviction to act.
Do you think there's more to the story for Stepan? Create your own Narrative to let the Community know!

This article by Simply Wall St is general in nature. We provide commentary based on historical data and analyst forecasts only using an unbiased methodology and our articles are not intended to be financial advice. It does not constitute a recommendation to buy or sell any stock, and does not take account of your objectives, or your financial situation. We aim to bring you long-term focused analysis driven by fundamental data. Note that our analysis may not factor in the latest price-sensitive company announcements or qualitative material. Simply Wall St has no position in any stocks mentioned.
New: Manage All Your Stock Portfolios in One Place
We've created the ultimate portfolio companion for stock investors, and it's free.
• Connect an unlimited number of Portfolios and see your total in one currency
• Be alerted to new Warning Signs or Risks via email or mobile
• Track the Fair Value of your stocks
Have feedback on this article? Concerned about the content? Get in touch with us directly. Alternatively, email editorial-team@simplywallst.com
About NYSE:SCL
Stepan
Produces and sells specialty and intermediate chemicals to other manufacturers for use in various end products worldwide.
Undervalued with proven track record and pays a dividend.
Similar Companies
Market Insights

Advertisement
Community Narratives
Kodiak AI - a potential 100 bagger opportunity?
Fair Value US$14.00|41.9% undervalued
DA
Community Contributor
A Fair Price for a Great Business Facing Real Threats
Fair Value US$383.06|14.1% undervalued
IM
Community Contributor
AXON And Shopify Integration Will Unlock Global Mobile Advertising
Fair Value US$613.59|1.3% undervalued
AN
Based on Analyst Price Targets