- United States
- /
- Metals and Mining
- /
- NYSE:RYI
The five-year decline in earnings for Ryerson Holding NYSE:RYI) isn't encouraging, but shareholders are still up 101% over that period


It hasn't been the best quarter for Ryerson Holding Corporation (NYSE:RYI) shareholders, since the share price has fallen 16% in that time. But at least the stock is up over the last five years. In that time, it is up 87%, which isn't bad, but is below the market return of 91%. While the long term returns are impressive, we do have some sympathy for those who bought more recently, given the 41% drop, in the last year.
Although Ryerson Holding has shed US$62m from its market cap this week, let's take a look at its longer term fundamental trends and see if they've driven returns.
See our latest analysis for Ryerson Holding
In his essay The Superinvestors of Graham-and-Doddsville Warren Buffett described how share prices do not always rationally reflect the value of a business. By comparing earnings per share (EPS) and share price changes over time, we can get a feel for how investor attitudes to a company have morphed over time.
During five years of share price growth, Ryerson Holding actually saw its EPS drop 10% per year.
Essentially, it doesn't seem likely that investors are focused on EPS. Because earnings per share don't seem to match up with the share price, we'll take a look at other metrics instead.
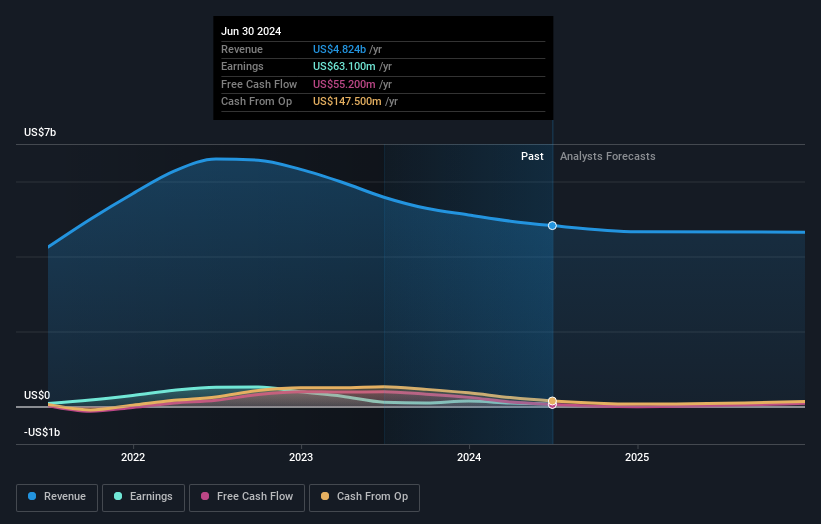
In fact, the dividend has increased over time, which is a positive. Maybe dividend investors have helped support the share price. We'd posit that the revenue growth over the last five years, of 6.5% per year, would encourage people to invest.
The graphic below depicts how earnings and revenue have changed over time (unveil the exact values by clicking on the image).
We like that insiders have been buying shares in the last twelve months. Even so, future earnings will be far more important to whether current shareholders make money. This free report showing analyst forecasts should help you form a view on Ryerson Holding
What About Dividends?
It is important to consider the total shareholder return, as well as the share price return, for any given stock. The TSR is a return calculation that accounts for the value of cash dividends (assuming that any dividend received was reinvested) and the calculated value of any discounted capital raisings and spin-offs. Arguably, the TSR gives a more comprehensive picture of the return generated by a stock. As it happens, Ryerson Holding's TSR for the last 5 years was 101%, which exceeds the share price return mentioned earlier. And there's no prize for guessing that the dividend payments largely explain the divergence!
A Different Perspective
Ryerson Holding shareholders are down 39% for the year (even including dividends), but the market itself is up 21%. However, keep in mind that even the best stocks will sometimes underperform the market over a twelve month period. On the bright side, long term shareholders have made money, with a gain of 15% per year over half a decade. It could be that the recent sell-off is an opportunity, so it may be worth checking the fundamental data for signs of a long term growth trend. While it is well worth considering the different impacts that market conditions can have on the share price, there are other factors that are even more important. Even so, be aware that Ryerson Holding is showing 3 warning signs in our investment analysis , you should know about...
If you like to buy stocks alongside management, then you might just love this free list of companies. (Hint: most of them are flying under the radar).
Please note, the market returns quoted in this article reflect the market weighted average returns of stocks that currently trade on American exchanges.
New: AI Stock Screener & Alerts
Our new AI Stock Screener scans the market every day to uncover opportunities.
• Dividend Powerhouses (3%+ Yield)
• Undervalued Small Caps with Insider Buying
• High growth Tech and AI Companies
Or build your own from over 50 metrics.
Have feedback on this article? Concerned about the content? Get in touch with us directly. Alternatively, email editorial-team (at) simplywallst.com.
This article by Simply Wall St is general in nature. We provide commentary based on historical data and analyst forecasts only using an unbiased methodology and our articles are not intended to be financial advice. It does not constitute a recommendation to buy or sell any stock, and does not take account of your objectives, or your financial situation. We aim to bring you long-term focused analysis driven by fundamental data. Note that our analysis may not factor in the latest price-sensitive company announcements or qualitative material. Simply Wall St has no position in any stocks mentioned.
About NYSE:RYI
Ryerson Holding
Processes and distributes industrial metals in the United States and internationally.
Excellent balance sheet second-rate dividend payer.
