Advertisement
- United States
- /
- Chemicals
- /
- NYSE:OLN
Does Olin’s Steep 40% Decline Signal Opportunity After Cost Cut Announcements?

Simply Wall St
Reviewed by Bailey Pemberton
- Curious if Olin stock could be a hidden bargain, or just a value trap? You are in the right place for a straightforward, numbers-first look at what the share price really means.
- Olin shares have had a rough ride recently, dropping 16.5% over the past week, 22.2% in the last month, and a significant 40.2% year-to-date. The stock is now sitting at about half the value it was a year ago.
- Some of this volatility traces to shifting expectations around the chemicals sector, with headlines focusing on weak demand and commodity pricing pressures. Other recent news highlights cost rationalization efforts by Olin, which investors are weighing as part of a potential longer-term turnaround.
- Before making any decisions, it is worth noting that Olin scores a 3 out of 6 on our valuation checks, meaning the stock looks undervalued in about half of our key measures. Next, we will break down those valuation methods and, most importantly, point out a smarter way to tie them all together by the end of this article.
Find out why Olin's -50.8% return over the last year is lagging behind its peers.
Approach 1: Olin Discounted Cash Flow (DCF) Analysis
The Discounted Cash Flow (DCF) model estimates a company's value by projecting its future cash flows and discounting them back to today. This method is widely used because it focuses directly on the company’s ability to generate cash, not just its earnings or assets.
For Olin, the most recent twelve months' Free Cash Flow stands at $21.47 million. Analysts provide detailed estimates for the next five years, and beyond that, projections are extrapolated. The company’s projected Free Cash Flow is expected to reach $671.80 million by 2035, with steady growth each year according to our model. Each of these future amounts is discounted appropriately to reflect today’s value, using a two-stage Free Cash Flow to Equity approach.
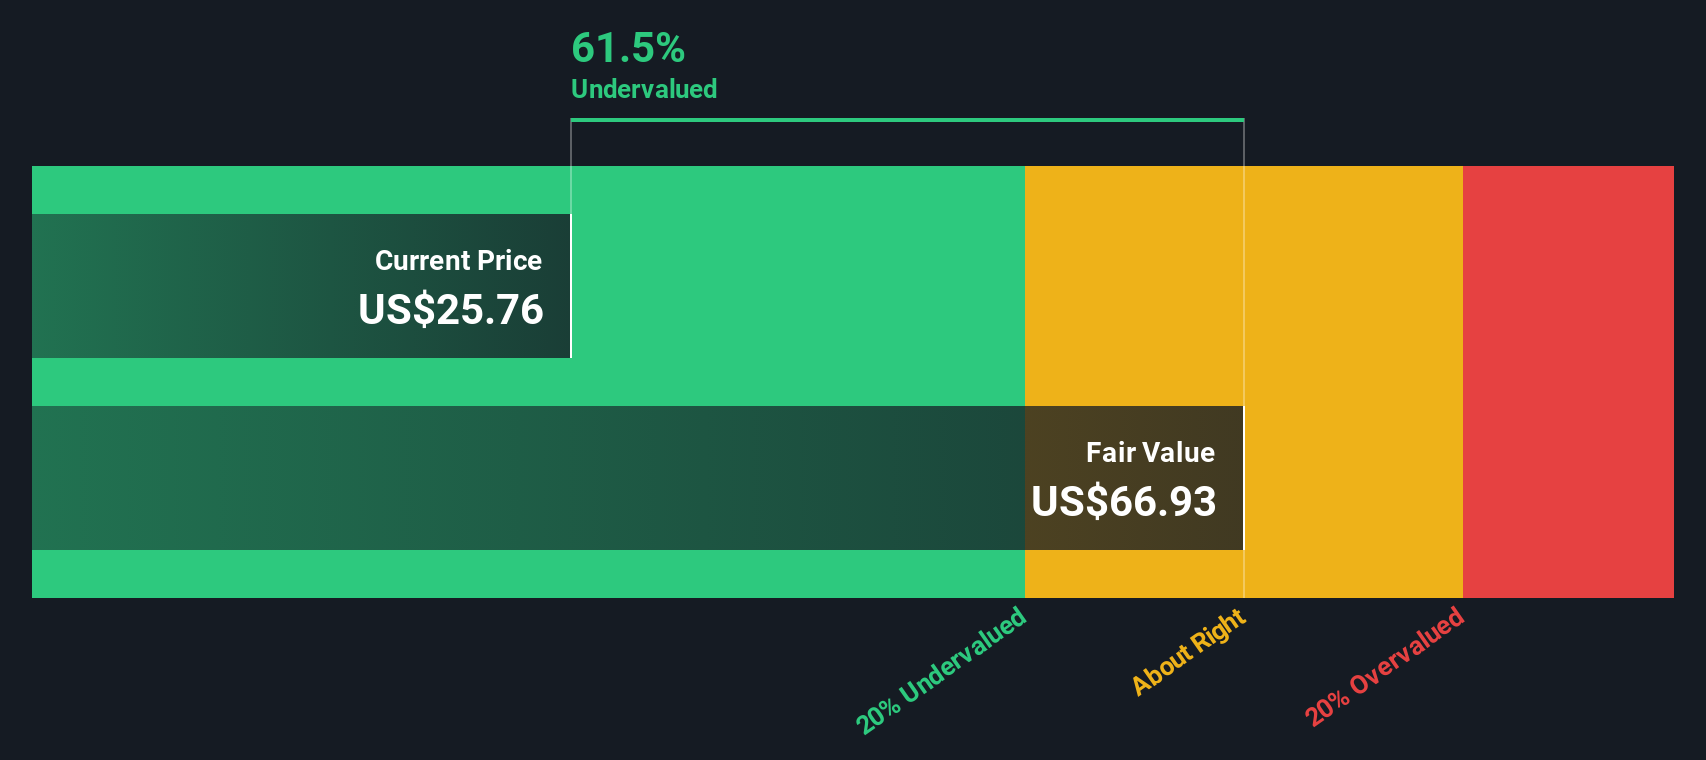
Based on these projections, the intrinsic value of Olin is estimated at $60.38 per share. With the current share price significantly below this value, the DCF suggests the stock is trading at a 66.8% discount. In simple terms, Olin appears meaningfully undervalued when you look at its cash-generating potential.
Result: UNDERVALUED
Our Discounted Cash Flow (DCF) analysis suggests Olin is undervalued by 66.8%. Track this in your watchlist or portfolio, or discover 841 more undervalued stocks based on cash flows.
Approach 2: Olin Price vs Earnings
For companies like Olin that are consistently profitable, the Price-to-Earnings (PE) ratio is a useful tool to assess value. The PE ratio tells you how much investors are paying for each dollar of profit today, which is especially meaningful when a company has a stable history of earnings. Generally, higher expected growth or lower risk justifies a higher PE, while lower growth prospects or additional risks should result in a lower PE ratio.
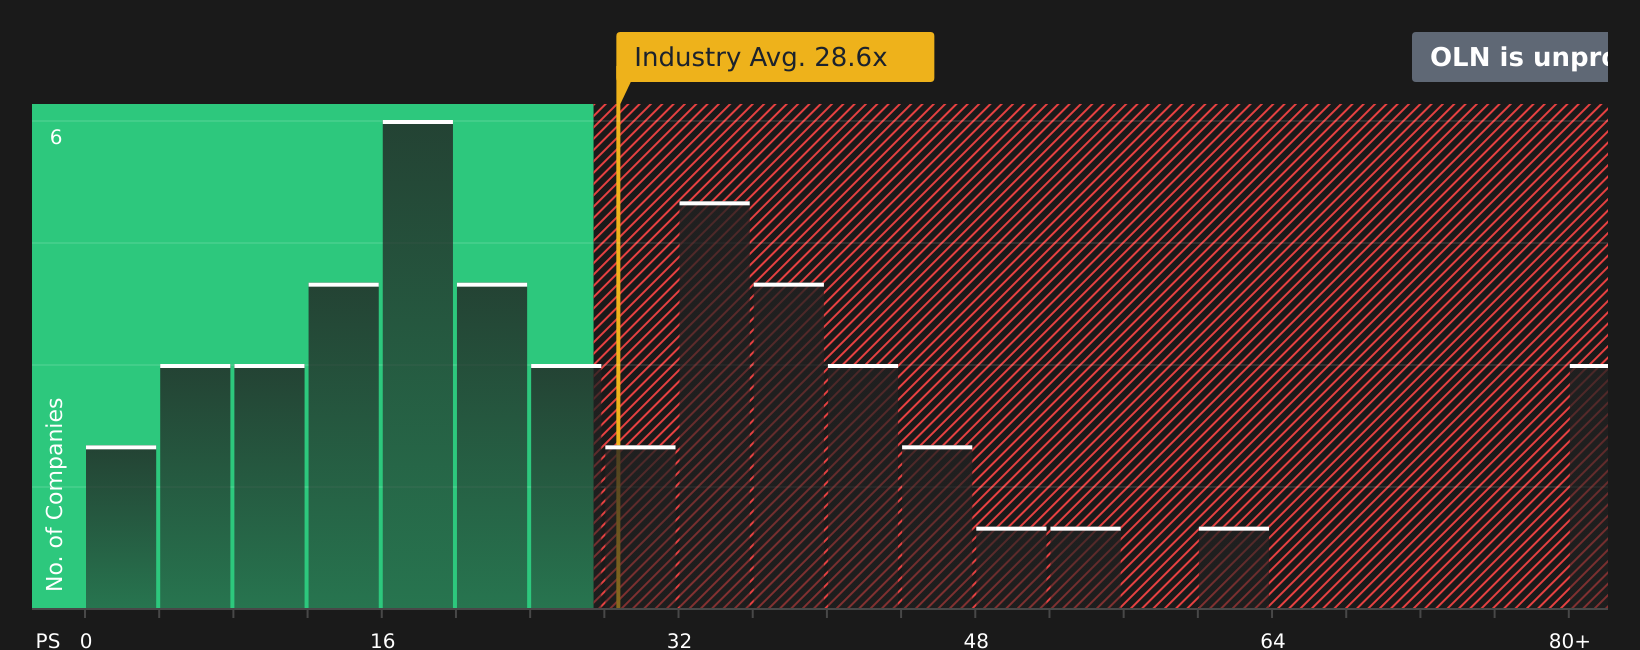
Right now, Olin trades at a PE of 42.69x. This is significantly higher than the industry average PE of 24.70x for the Chemicals sector, and well above the average for its closest peers at 15.26x. At first glance, this might make the stock seem expensive relative to both its sector and its peer group.
However, Simply Wall St’s proprietary “Fair Ratio” model provides a more nuanced benchmark. Unlike a plain industry or peer comparison, the Fair Ratio adjusts for Olin’s own profit margin, expected growth, market capitalization, and the risks it faces. For Olin, this Fair Ratio currently stands at 53.95x, reflecting the company’s unique outlook and risk profile. Comparing the actual PE (42.69x) to the Fair Ratio (53.95x), the stock appears to be trading at a discount based on the fundamentals that matter most to shareholders.
Result: UNDERVALUED
PE ratios tell one story, but what if the real opportunity lies elsewhere? Discover 1411 companies where insiders are betting big on explosive growth.
Upgrade Your Decision Making: Choose your Olin Narrative
Earlier we mentioned that there is an even better way to understand valuation, so let us introduce you to Narratives. A Narrative is a clear, customizable story that you build about Olin, connecting what you know about the company, your best guesses for future revenue, earnings, and margins, and your own sense of what the stock should be worth. It links Olin’s real-world story to a financial forecast and then directly to an estimated fair value, so you can see how the numbers and your perspective work together.
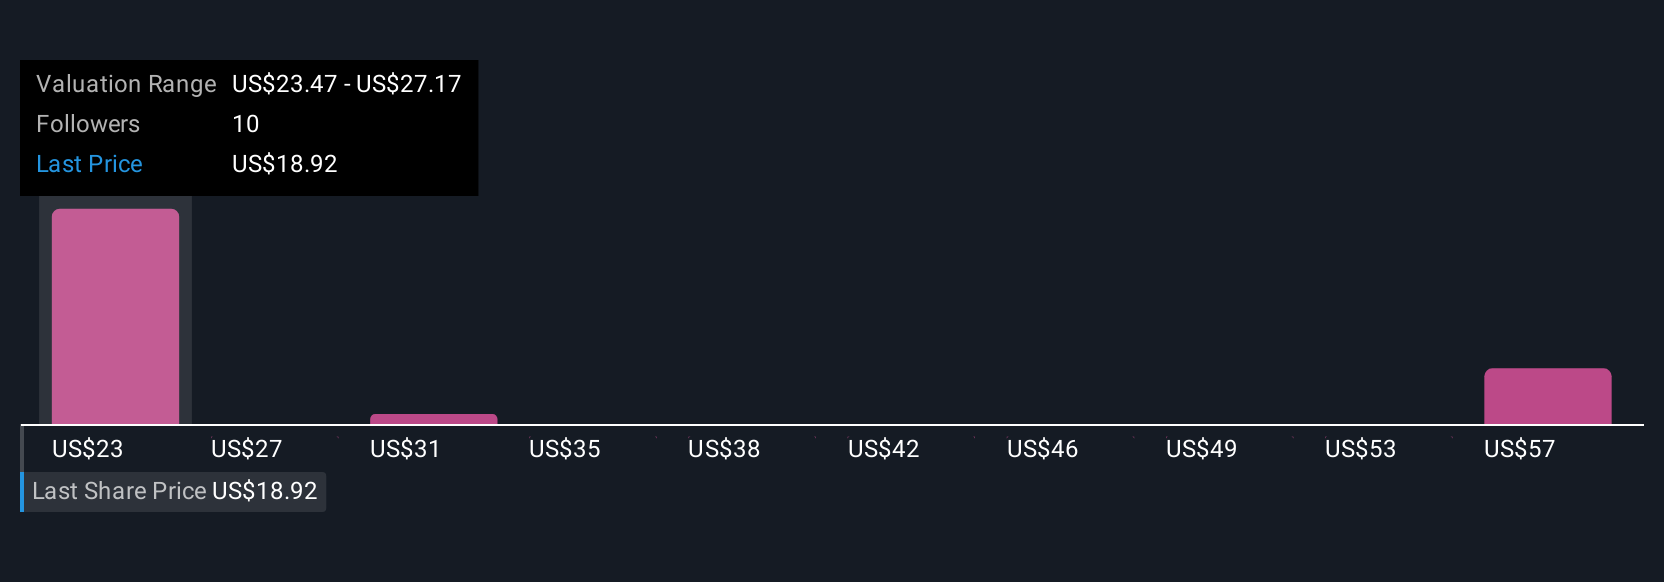
Narratives are easy to use and available to all investors on Simply Wall St's Community page, where millions share and update their views. They provide a dynamic tool to guide buy or sell decisions. When news breaks or earnings change, your Narrative updates automatically, recalculating fair value and risk in real time. For example, some Olin investors might focus on major cost reductions and predict margin improvements, supporting a Narrative fair value as high as $31 per share. Others might stress stiff competition, leading to a cautious $20 fair value. Narratives let you align your investment decision with the story, the numbers, and your unique perspective, all in one place.
Do you think there's more to the story for Olin? Head over to our Community to see what others are saying!
This article by Simply Wall St is general in nature. We provide commentary based on historical data and analyst forecasts only using an unbiased methodology and our articles are not intended to be financial advice. It does not constitute a recommendation to buy or sell any stock, and does not take account of your objectives, or your financial situation. We aim to bring you long-term focused analysis driven by fundamental data. Note that our analysis may not factor in the latest price-sensitive company announcements or qualitative material. Simply Wall St has no position in any stocks mentioned.
New: AI Stock Screener & Alerts
Our new AI Stock Screener scans the market every day to uncover opportunities.
• Dividend Powerhouses (3%+ Yield)
• Undervalued Small Caps with Insider Buying
• High growth Tech and AI Companies
Or build your own from over 50 metrics.
Have feedback on this article? Concerned about the content? Get in touch with us directly. Alternatively, email editorial-team@simplywallst.com
About NYSE:OLN
Olin
Manufactures and distributes chemical products in the United States, Europe, Asia Pacific, Latin America, and Canada.
Slight risk and fair value.
Similar Companies
Market Insights

Advertisement
Community Narratives
The company that turned a verb into a global necessity and basically runs the modern internet, digital ads, smartphones, maps, and AI.
Fair Value US$300.00|5.4% undervalued
OS
Community Contributor
Flowers Foods Pays A Fair Price For Health
Fair Value US$16.12|26.3% undervalued
NV
Community Contributor
TMX Group will thrive with 33.3% profit margin and enduring market moat
Fair Value CA$49.90|4.1% overvalued
LI
Community Contributor
The "Molecular Pencil": Why Beam's Technology is Built to Win
Fair Value US$65.01|62.7% undervalued
DA
Community Contributor