
Advertisement
- United States
- /
- Chemicals
- /
- NYSE:NGVT
How Does Ingevity's (NYSE:NGVT) P/E Compare To Its Industry, After Its Big Share Price Gain?

Ingevity (NYSE:NGVT) shareholders are no doubt pleased to see that the share price has bounced 41% in the last month alone, although it is still down 52% over the last quarter. But that will do little to salve the savage burn caused by the 64% share price decline, over the last year.
All else being equal, a sharp share price increase should make a stock less attractive to potential investors. While the market sentiment towards a stock is very changeable, in the long run, the share price will tend to move in the same direction as earnings per share. The implication here is that deep value investors might steer clear when expectations of a company are too high. One way to gauge market expectations of a stock is to look at its Price to Earnings Ratio (PE Ratio). A high P/E implies that investors have high expectations of what a company can achieve compared to a company with a low P/E ratio.
Check out our latest analysis for Ingevity
How Does Ingevity's P/E Ratio Compare To Its Peers?
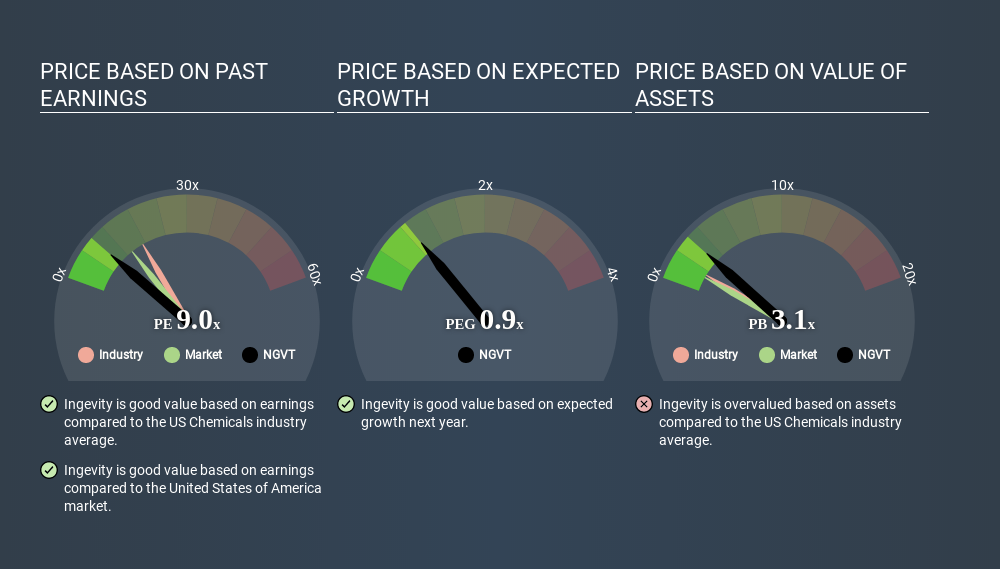
Ingevity's P/E of 9.03 indicates relatively low sentiment towards the stock. If you look at the image below, you can see Ingevity has a lower P/E than the average (17.2) in the chemicals industry classification.
This suggests that market participants think Ingevity will underperform other companies in its industry. While current expectations are low, the stock could be undervalued if the situation is better than the market assumes. You should delve deeper. I like to check if company insiders have been buying or selling.
How Growth Rates Impact P/E Ratios
P/E ratios primarily reflect market expectations around earnings growth rates. That's because companies that grow earnings per share quickly will rapidly increase the 'E' in the equation. That means even if the current P/E is high, it will reduce over time if the share price stays flat. And as that P/E ratio drops, the company will look cheap, unless its share price increases.
Ingevity saw earnings per share improve by 9.2% last year. And its annual EPS growth rate over 5 years is 7.5%.
A Limitation: P/E Ratios Ignore Debt and Cash In The Bank
One drawback of using a P/E ratio is that it considers market capitalization, but not the balance sheet. Thus, the metric does not reflect cash or debt held by the company. Hypothetically, a company could reduce its future P/E ratio by spending its cash (or taking on debt) to achieve higher earnings.
Such spending might be good or bad, overall, but the key point here is that you need to look at debt to understand the P/E ratio in context.
How Does Ingevity's Debt Impact Its P/E Ratio?
Ingevity has net debt worth 67% of its market capitalization. This is enough debt that you'd have to make some adjustments before using the P/E ratio to compare it to a company with net cash.
The Verdict On Ingevity's P/E Ratio
Ingevity's P/E is 9.0 which is below average (13.6) in the US market. It's good to see EPS growth in the last 12 months, but the debt on the balance sheet might be muting expectations. What we know for sure is that investors are becoming less uncomfortable about Ingevity's prospects, since they have pushed its P/E ratio from 6.4 to 9.0 over the last month. For those who like to invest in turnarounds, that might mean it's time to put the stock on a watchlist, or research it. But others might consider the opportunity to have passed.
Investors have an opportunity when market expectations about a stock are wrong. If the reality for a company is not as bad as the P/E ratio indicates, then the share price should increase as the market realizes this. So this free report on the analyst consensus forecasts could help you make a master move on this stock.
You might be able to find a better buy than Ingevity. If you want a selection of possible winners, check out this free list of interesting companies that trade on a P/E below 20 (but have proven they can grow earnings).
If you spot an error that warrants correction, please contact the editor at editorial-team@simplywallst.com. This article by Simply Wall St is general in nature. It does not constitute a recommendation to buy or sell any stock, and does not take account of your objectives, or your financial situation. Simply Wall St has no position in the stocks mentioned.
We aim to bring you long-term focused research analysis driven by fundamental data. Note that our analysis may not factor in the latest price-sensitive company announcements or qualitative material. Thank you for reading.
About NYSE:NGVT
Ingevity
Manufactures and sells activated carbon products, derivative specialty chemicals, and engineered polymers in North America, the Asia Pacific, Europe, the Middle East, Africa, and South America.
Fair value with moderate growth potential.
Similar Companies
Market Insights


Advertisement
Community Narratives
For the Emperor: Why Games Workshop Could Be a Star Investment
Fair Value UK£160.00|0.4% overvalued
RO
Community Contributor
Securitas will boost margins with AI and tech-driven services
Fair Value SEK 260.91|44.5% undervalued
UN
Community Contributor
A Leader in EV Charging with Growth Potential
Fair Value €27.00|17.8% undervalued
TI
Community Contributor