Advertisement
- United States
- /
- Metals and Mining
- /
- NYSE:NEM
Newmont (NEM) Returns to Profitability, Undercutting Industry Valuation Narratives

Simply Wall St
Reviewed by Simply Wall St
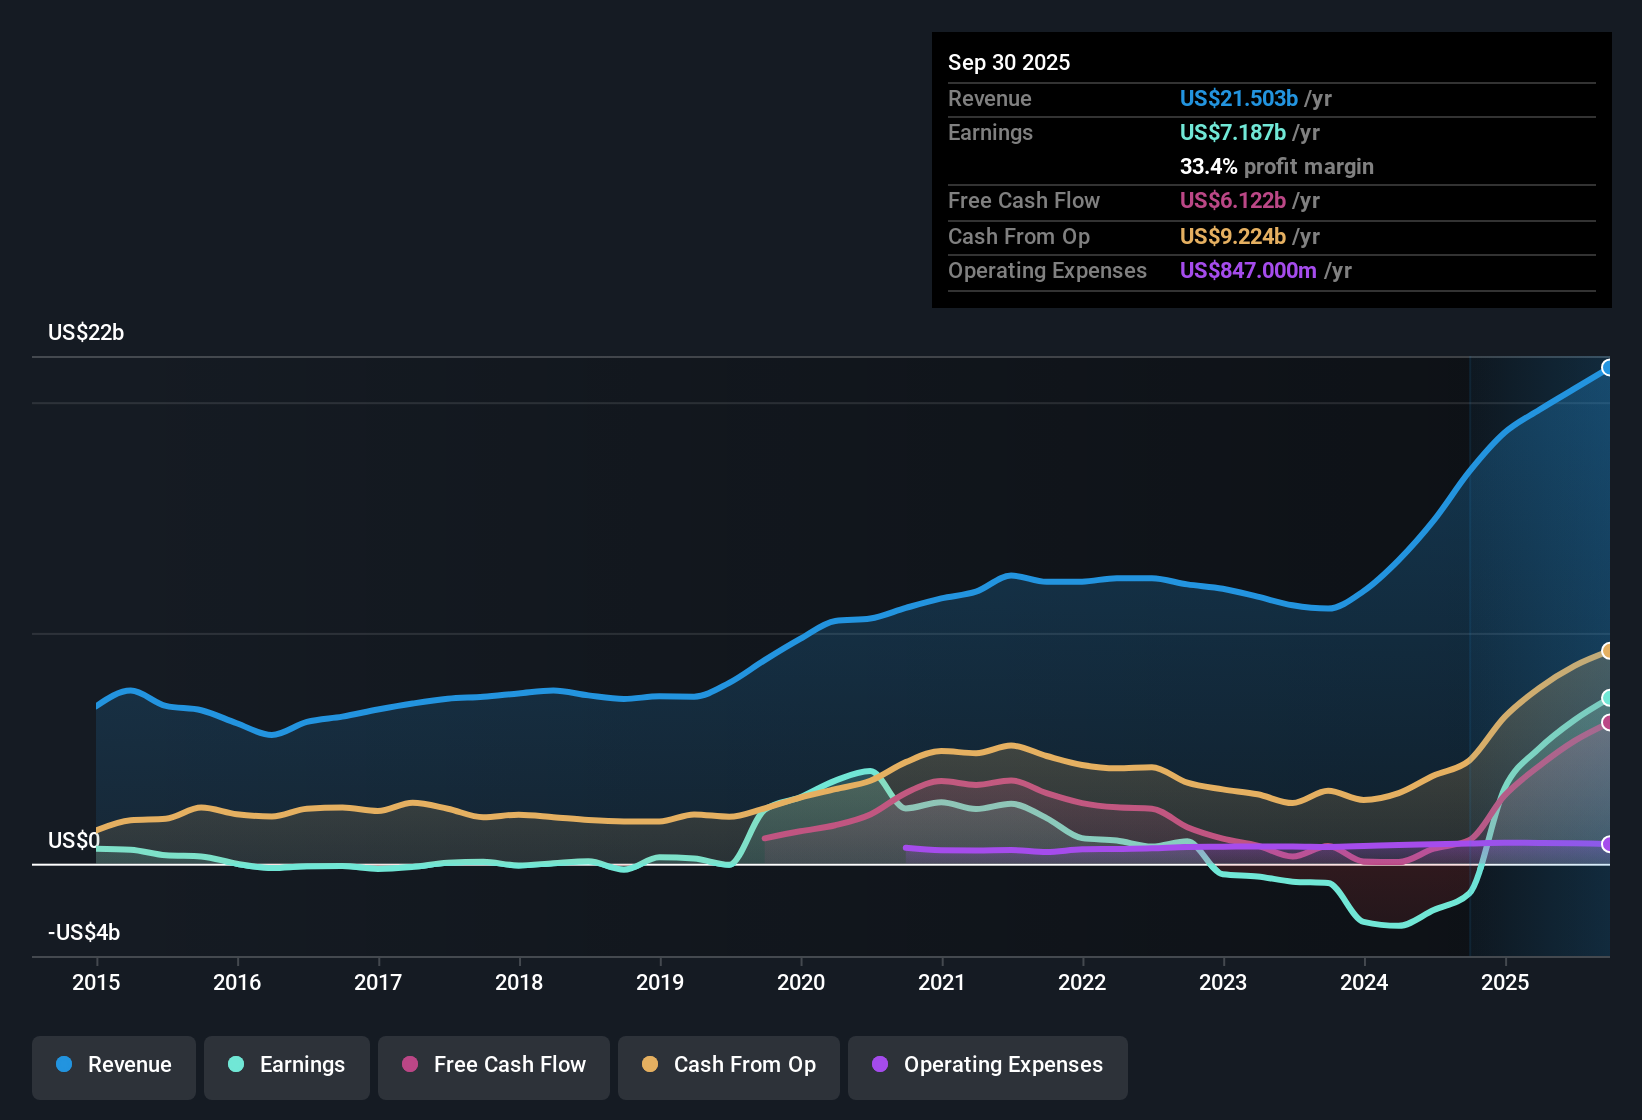
Newmont (NEM) posted a five-year annual earnings growth rate of 9.5% and has recently returned to profitability, with revenue and earnings projected to grow at 3.9% and 2.6% per year respectively. Although both rates trail the broader US market’s expected 10% revenue and 15.5% earnings growth, Newmont now boasts high-quality earnings and improved net profit margins. For investors, the highlights include a discounted valuation, a clean risk profile, and continued profit momentum even as future growth moderates.
See our full analysis for Newmont.The next section examines how these earnings figures align with prevailing narratives about Newmont in the investor community, or challenge them.
See what the community is saying about Newmont
Analyst Price Target Sits Below Current Share Price
- Newmont’s current share price is $83.37, which is 18.7% higher than the analyst consensus price target of $70.25. This suggests the market is pricing in more optimism than analysts are forecasting.
- According to the analysts' consensus view, stable gold demand and improved operational efficiency support solid future growth. However, the muted consensus price target reveals that not all long-term risks are priced in.
- The range of analyst price targets, from $58.00 up to $104.00, hints at ongoing debate about future asset quality and cash flow durability, particularly as capital spending rises and several assets face lower-grade ore production.
- Net profit margins are expected to slip slightly from 30.3% to 29.7% in three years. This is a key reason analysts are not raising targets in line with recent share gains.
PE Ratio at a Deep Discount Versus Industry Peers
- At 12.7x, Newmont’s Price-to-Earnings Ratio is barely half the US Metals and Mining industry average of 24.9x and far below the peer average of 36x. This signals the shares trade at a significant valuation discount.
- The consensus narrative points out that Newmont’s discounted valuation, especially relative to both the broader market and direct competitors, could appeal to value-focused investors if operational efficiencies and projected cash flows materialize.
- Even after accounting for moderate growth forecasts, the undercutting of peer multiples suggests room for re-rating if ongoing efficiency and asset integration efforts yield stronger results.
- However, the slight decline in expected profit margins and a cautious outlook for production growth may limit how quickly that gap closes.
No Material Risks Flagged by Latest Filing
- The company’s most recent disclosures and reviewed data indicate a clean risk profile, with no material operational, financial, or regulatory risks newly identified.
- The analysts’ consensus narrative notes that while the absence of flagged risks is reassuring for now, emerging challenges such as capital project spending, leadership transitions, and reliance on asset sales still cast a shadow on Newmont’s ability to sustain current growth and margins.
- Leadership changes and complex integration of acquired operations could threaten execution. Still, the lack of immediate red flags helps support management’s positive outlook and market confidence.
- Future reductions in free cash flow remain possible if planned increases in capital expenditures and lower output from aging mines are not offset by higher gold prices or successful cost saving.
Next Steps
To see how these results tie into long-term growth, risks, and valuation, check out the full range of community narratives for Newmont on Simply Wall St. Add the company to your watchlist or portfolio so you'll be alerted when the story evolves.
Think the data tells a different story? Put your own view together in just a few minutes and shape the narrative from your unique perspective. Do it your way
A good starting point is our analysis highlighting 4 key rewards investors are optimistic about regarding Newmont.
See What Else Is Out There
Despite Newmont’s improving profitability and efficient operations, soft revenue growth and margin pressures highlight challenges in sustaining faster expansion compared to the industry.
If you want consistent top- and bottom-line results through market cycles, use stable growth stocks screener (2098 results) to find companies built for steady, reliable growth.
This article by Simply Wall St is general in nature. We provide commentary based on historical data and analyst forecasts only using an unbiased methodology and our articles are not intended to be financial advice. It does not constitute a recommendation to buy or sell any stock, and does not take account of your objectives, or your financial situation. We aim to bring you long-term focused analysis driven by fundamental data. Note that our analysis may not factor in the latest price-sensitive company announcements or qualitative material. Simply Wall St has no position in any stocks mentioned.
Valuation is complex, but we're here to simplify it.
Discover if Newmont might be undervalued or overvalued with our detailed analysis, featuring fair value estimates, potential risks, dividends, insider trades, and its financial condition.
Access Free AnalysisHave feedback on this article? Concerned about the content? Get in touch with us directly. Alternatively, email editorial-team@simplywallst.com
About NYSE:NEM
Very undervalued with excellent balance sheet.
Similar Companies
Market Insights

Advertisement
Community Narratives
Finding The True Value Of A Logistics Powerhouse
Fair Value US$95.21|8.4% undervalued
NV
Community Contributor
Paradigm Biopharmaceuticals Will Lead Osteoarthritis Treatment with Zilosul's FDA Success
Fair Value AU$5.50|92.1% undervalued
AM
Community Contributor
Barrick Mining (ABX:CA): A Gold Hedge against a U.S. Shutdown
Fair Value CA$60.00|24.2% undervalued
GM
Community Contributor