Stock Analysis
- United States
- /
- Packaging
- /
- NYSE:GPK
Graphic Packaging Holding's (NYSE:GPK) investors will be pleased with their strong 127% return over the last five years
When you buy a stock there is always a possibility that it could drop 100%. But when you pick a company that is really flourishing, you can make more than 100%. Long term Graphic Packaging Holding Company (NYSE:GPK) shareholders would be well aware of this, since the stock is up 107% in five years. On top of that, the share price is up 16% in about a quarter. But this could be related to the strong market, which is up 13% in the last three months.
So let's investigate and see if the longer term performance of the company has been in line with the underlying business' progress.
View our latest analysis for Graphic Packaging Holding
In his essay The Superinvestors of Graham-and-Doddsville Warren Buffett described how share prices do not always rationally reflect the value of a business. One imperfect but simple way to consider how the market perception of a company has shifted is to compare the change in the earnings per share (EPS) with the share price movement.
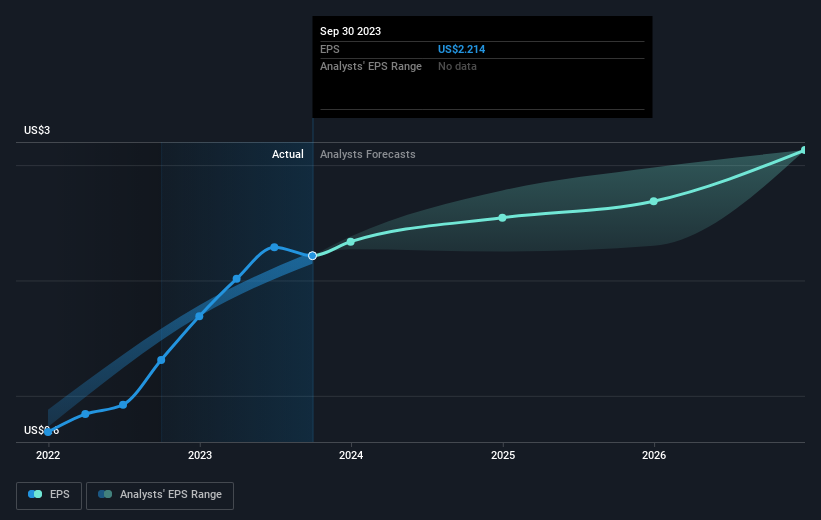
Over half a decade, Graphic Packaging Holding managed to grow its earnings per share at 15% a year. This EPS growth is reasonably close to the 16% average annual increase in the share price. That suggests that the market sentiment around the company hasn't changed much over that time. In fact, the share price seems to largely reflect the EPS growth.
The company's earnings per share (over time) is depicted in the image below (click to see the exact numbers).
We know that Graphic Packaging Holding has improved its bottom line over the last three years, but what does the future have in store? Take a more thorough look at Graphic Packaging Holding's financial health with this free report on its balance sheet.
What About Dividends?
It is important to consider the total shareholder return, as well as the share price return, for any given stock. The TSR is a return calculation that accounts for the value of cash dividends (assuming that any dividend received was reinvested) and the calculated value of any discounted capital raisings and spin-offs. Arguably, the TSR gives a more comprehensive picture of the return generated by a stock. In the case of Graphic Packaging Holding, it has a TSR of 127% for the last 5 years. That exceeds its share price return that we previously mentioned. And there's no prize for guessing that the dividend payments largely explain the divergence!
A Different Perspective
Graphic Packaging Holding shareholders are up 9.0% for the year (even including dividends). But that return falls short of the market. If we look back over five years, the returns are even better, coming in at 18% per year for five years. It's quite possible the business continues to execute with prowess, even as the share price gains are slowing. While it is well worth considering the different impacts that market conditions can have on the share price, there are other factors that are even more important. To that end, you should be aware of the 2 warning signs we've spotted with Graphic Packaging Holding .
If you are like me, then you will not want to miss this free list of growing companies that insiders are buying.
Please note, the market returns quoted in this article reflect the market weighted average returns of stocks that currently trade on American exchanges.
Valuation is complex, but we're helping make it simple.
Find out whether Graphic Packaging Holding is potentially over or undervalued by checking out our comprehensive analysis, which includes fair value estimates, risks and warnings, dividends, insider transactions and financial health.
View the Free AnalysisHave feedback on this article? Concerned about the content? Get in touch with us directly. Alternatively, email editorial-team (at) simplywallst.com.
This article by Simply Wall St is general in nature. We provide commentary based on historical data and analyst forecasts only using an unbiased methodology and our articles are not intended to be financial advice. It does not constitute a recommendation to buy or sell any stock, and does not take account of your objectives, or your financial situation. We aim to bring you long-term focused analysis driven by fundamental data. Note that our analysis may not factor in the latest price-sensitive company announcements or qualitative material. Simply Wall St has no position in any stocks mentioned.
About NYSE:GPK
Graphic Packaging Holding
Graphic Packaging Holding Company, together with its subsidiaries, designs, produces, and sells consumer packaging products to brands in food, beverage, foodservice, household, and other consumer products.
Undervalued with solid track record.

