Advertisement
- United States
- /
- Metals and Mining
- /
- NYSE:DRD
A Fresh Look at DRDGOLD (NYSE:DRD) Valuation Following Latest Quarterly Performance Update

Simply Wall St
Reviewed by Simply Wall St
DRDGOLD (NYSE:DRD) published its quarterly operating and sales results for the period ending 30 September 2025, giving investors fresh numbers on gold production, sales volume, and operational performance to consider.
See our latest analysis for DRDGOLD.
DRDGOLD’s latest quarterly update arrived after a remarkable run, as the company’s share price surged 183.7% year-to-date and stands at $25.59. While a sharp pullback in the past week hints at renewed volatility, the three-year total shareholder return of 432.7% puts its longer-term momentum in the spotlight and suggests many investors are still seeing growth potential despite recent swings.
If this kind of action has you watching for other potential standouts, now is a great time to broaden your perspective and discover fast growing stocks with high insider ownership
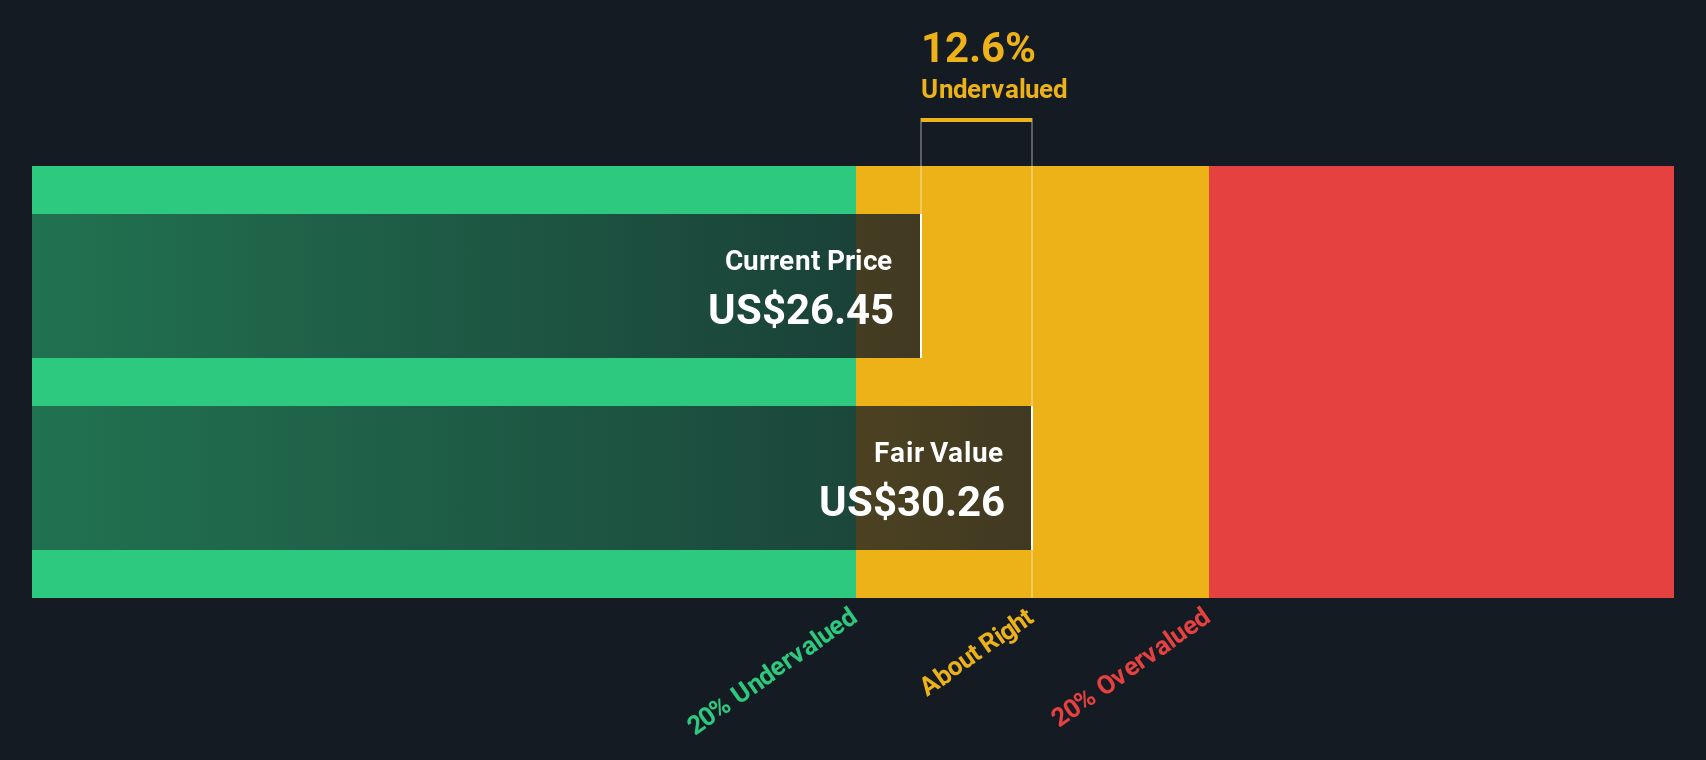
With shares up sharply and fresh results on the table, the key question is whether DRDGOLD is trading below its intrinsic value or if the current price already reflects all the expected growth. This leaves investors to wonder if there is a genuine buying opportunity or if the market has already anticipated what comes next.
Price-to-Earnings of 17.1x: Is it justified?
DRDGOLD trades at a price-to-earnings ratio of 17.1x, noticeably below both its major industry and peer group averages. This hints at a potential valuation gap for investors to consider.
The price-to-earnings (P/E) ratio reflects how much investors are willing to pay today for a dollar of earnings. For DRDGOLD, this is an especially relevant measure because the company has delivered rapid profit growth in the past year. As a result, its current earnings power is a central focus for market watchers.
With DRDGOLD’s P/E ratio substantially lower than the US Metals and Mining industry average of 24.9x and even further below the peer average of 31.7x, the market appears to be giving a significant discount relative to comparable firms. This suggests investors may be underestimating DRDGOLD’s earnings quality or its growth trajectory despite its recent performance surge.
See what the numbers say about this price — find out in our valuation breakdown.
Result: Price-to-Earnings of 17.1x (UNDERVALUED)
However, ongoing gold price volatility and potential operational challenges could quickly shift sentiment. This serves as a reminder to investors that rapid gains are never guaranteed.
Find out about the key risks to this DRDGOLD narrative.
Another View: Discounted Cash Flow Puts Undervaluation in the Spotlight
Looking through a different lens, our DCF model suggests DRDGOLD’s fair value sits at $52.37, nearly double its current price of $25.59. This method presents a picture of a stock that could be dramatically undervalued and raises new questions about market expectations and unpriced opportunities.
Look into how the SWS DCF model arrives at its fair value.
Simply Wall St performs a discounted cash flow (DCF) on every stock in the world every day (check out DRDGOLD for example). We show the entire calculation in full. You can track the result in your watchlist or portfolio and be alerted when this changes, or use our stock screener to discover undervalued stocks based on their cash flows. If you save a screener we even alert you when new companies match - so you never miss a potential opportunity.
Build Your Own DRDGOLD Narrative
If you see things differently or want to form your own view, you can build a personalised story around DRDGOLD’s numbers in just minutes, so why not Do it your way
A great starting point for your DRDGOLD research is our analysis highlighting 3 key rewards and 1 important warning sign that could impact your investment decision.
Ready for More Smart Opportunities?
Don’t let the next wave of potential pass you by. Tap into powerful stock ideas designed to help you get ahead of market trends and find real value fast.
- Maximize your yield potential by checking out these 17 dividend stocks with yields > 3% featuring companies with attractive and consistent payouts.
- Catch the momentum in AI innovation by following these 27 AI penny stocks where emerging leaders are leveraging artificial intelligence to redefine entire industries.
- Take charge of your portfolio’s growth by searching for value gems among these 875 undervalued stocks based on cash flows trading well below their intrinsic worth.
This article by Simply Wall St is general in nature. We provide commentary based on historical data and analyst forecasts only using an unbiased methodology and our articles are not intended to be financial advice. It does not constitute a recommendation to buy or sell any stock, and does not take account of your objectives, or your financial situation. We aim to bring you long-term focused analysis driven by fundamental data. Note that our analysis may not factor in the latest price-sensitive company announcements or qualitative material. Simply Wall St has no position in any stocks mentioned.
New: Manage All Your Stock Portfolios in One Place
We've created the ultimate portfolio companion for stock investors, and it's free.
• Connect an unlimited number of Portfolios and see your total in one currency
• Be alerted to new Warning Signs or Risks via email or mobile
• Track the Fair Value of your stocks
Have feedback on this article? Concerned about the content? Get in touch with us directly. Alternatively, email editorial-team@simplywallst.com
About NYSE:DRD
DRDGOLD
A gold mining company, engages in the extraction of gold from the retreatment of surface mine tailings in South Africa.
Outstanding track record with excellent balance sheet and pays a dividend.
Similar Companies
Market Insights

Advertisement
Community Narratives
Finding The True Value Of A Logistics Powerhouse
Fair Value US$95.21|8.6% undervalued
NV
Community Contributor
Paradigm Biopharmaceuticals Will Lead Osteoarthritis Treatment with Zilosul's FDA Success
Fair Value AU$5.50|92.1% undervalued
AM
Community Contributor
Barrick Mining (ABX:CA): A Gold Hedge against a U.S. Shutdown
Fair Value CA$60.00|25.6% undervalued
GM
Community Contributor