Advertisement
- United States
- /
- Chemicals
- /
- NYSE:ALB
Spot Lithium Prices are Driving Albemarle Corporation's (NYSE:ALB) Expectations

Lithium is one of the critical elements in the ongoing effort to phase out fossil fuels and create a "greener "environment. Thus, it was not surprising to see that mining giants like Albemarle Corporation (NYSE: ALB) doing well in the last 2 years.
Yet, after a 30% decline from the highs, the bearish momentum doesn't seem to slow down. Meanwhile, the insiders are stepping in.
View our latest analysis for Albemarle
Full-year 2021 results:
- EPS: US$1.07 (down from US$3.53 in FY 2020).
- Revenue: US$3.33b (up 6.4% from FY 2020).
- Net income: US$123.7m (down 67% from FY 2020).
- Profit margin: 3.7% (down from 12% in FY 2020).
Revenue was in line with analyst estimates. Earnings per share (EPS) missed analyst estimates by 50%.
Over the next year, revenue is forecast to grow 28%, compared to a 9.8% growth forecast for the industry in the US. Over the last 3 years, on average, earnings per share have fallen by 30% per year, but its share price has increased by 29% per year, which means it is well ahead of earnings.
Consider the following price movement of lithium.
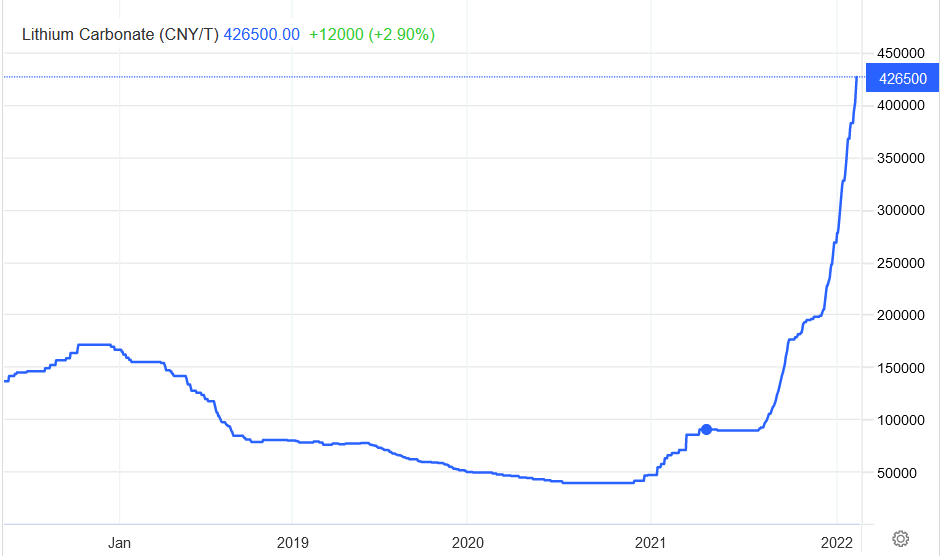
Meanwhile, the analysts were surprised to hear the following guidance from the company.
- FY 2022 EPS: US$5.65-6.65 vs. US$6.20 consensus
- FY 2022 revenue: US$4.2b-US$4.5b vs US$4b consensus
Arguably, the market doesn't follow the lag between the spot prices and prices that the company realizes with contract customers. Thus, short-term speculators jump on the upwards momentum, magnifying the stock's potential before getting caught up in this disparity.
Using a Discounted Cash Flow (DCF) Model to Calculate the Intrinsic Value of ALB
We're using the 2-stage growth model, which means we take two stages of the company's growth. In the initial period, the company may have a higher growth rate, and the second stage is usually assumed to have a stable growth rate. First, we need to estimate the next ten years of cash flows. Where possible, we use analyst estimates, but when these aren't available, we extrapolate the previous free cash flow (FCF) from the last estimate or reported value.
We assume companies with shrinking free cash flow will slow their rate of shrinkage and that companies with growing free cash flow will see their growth rate slow over this period. We do this to reflect that growth tends to slow more in the early years than in later years.
Generally, we assume that a dollar today is more valuable than a dollar in the future, so we discount the value of these future cash flows to their estimated value in today's dollars:
10-year free cash flow (FCF) estimate
| 2022 | 2023 | 2024 | 2025 | 2026 | 2027 | 2028 | 2029 | 2030 | 2031 | |
| Levered FCF ($, Millions) | -US$929.1m | -US$160.1m | US$207.9m | US$549.4m | US$1.12b | US$1.61b | US$2.12b | US$2.60b | US$3.03b | US$3.40b |
| Growth Rate Estimate Source | Analyst x5 | Analyst x7 | Analyst x4 | Analyst x4 | Analyst x3 | Est @ 44.42% | Est @ 31.67% | Est @ 22.75% | Est @ 16.5% | Est @ 12.12% |
| Present Value ($, Millions) Discounted @ 6.2% | -US$875 | -US$142 | US$174 | US$432 | US$825 | US$1.1k | US$1.4k | US$1.6k | US$1.8k | US$1.9k |
("Est" = FCF growth rate estimated by Simply Wall St)
Present Value of 10-year Cash Flow (PVCF) = US$8.2b
After calculating the present value of future cash flows in the initial 10-year period, we need to calculate the Terminal Value, which accounts for all future cash flows beyond the first stage. The Gordon Growth formula is used to calculate Terminal Value at a future annual growth rate equal to the 5-year average of the 10-year government bond yield of 1.9%. We discount the terminal cash flows to today's value at the cost of equity of 6.2%.
Terminal Value (TV)= FCF2031 × (1 + g) ÷ (r – g) = US$3.4b× (1 + 1.9%) ÷ (6.2%– 1.9%) = US$81b
Present Value of Terminal Value (PVTV)= TV / (1 + r)10= US$81b÷ ( 1 + 6.2%)10= US$44b
The total value is the sum of cash flows for the next ten years plus the discounted terminal value, which results in the Total Equity Value, which in this case is US$52b. The last step is to divide the equity value by the number of shares outstanding.
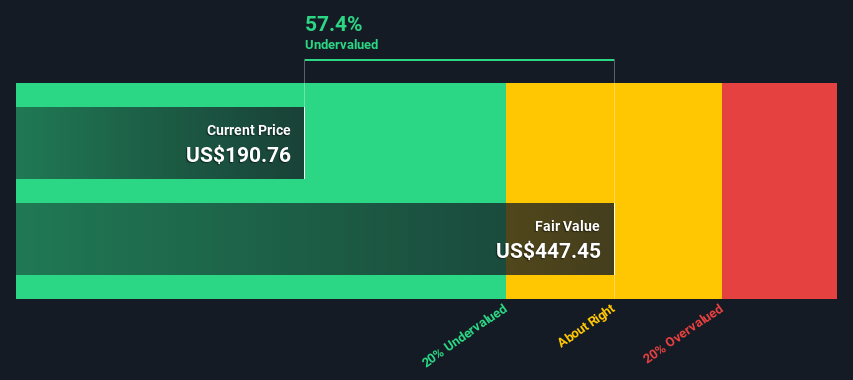
Relative to the current share price of US$191, the company appears potentially underpriced at a discount of over 50%. This might sound concerning, and we recommend potential investors dig deeper.
The assumptions
The calculation above is very dependent on two assumptions. The first is the discount rate, and the other is the cash flow. The DCF does not consider the possible cyclicality of an industry or its future capital requirements, so it does not give a complete picture of its potential performance.
Given that we are looking at Albemarle as potential shareholders, the cost of equity is used as the discount rate rather than the cost of capital (or the weighted average cost of capital, WACC), which accounts for debt. We've used 6.2%, based on a levered beta of 1.013. Beta is a measure of a stock's volatility compared to the market as a whole.
Looking Ahead:
Although the stock has declined, it doesn't show signs of slowing down. However, insiders are starting to buy - as you can see on our platform. Insiders generally sell for different reasons, but they buy only for one - when they expect the price to go up.
While our model shows the company as significantly undervalued, DCF models are not foolproof. Instead, it should be seen as a guide to "what assumptions need to be true for this stock to be under/overvalued?" If a company grows at a different rate, or if its cost of equity or risk-free rate changes sharply, the output can look very different.
For Albemarle, we've put together three relevant aspects you should further examine:
- Risks: As an example, we've found 3 warning signs for Albemarle that you need to consider before investing here.
- Future Earnings: How does ALB's growth rate compare to its peers and the wider market? Dig deeper into the analyst consensus number for the upcoming years by interacting with our free analyst growth expectation chart.
- Other High-Quality Alternatives: Do you like a good all-rounder? Explore our interactive list of high quality stocks to get an idea of what else is out there you may be missing!
PS. Simply Wall St updates its DCF calculation for every American stock every day, so if you want to find the intrinsic value of any other stock, search here.
New: Manage All Your Stock Portfolios in One Place
We've created the ultimate portfolio companion for stock investors, and it's free.
• Connect an unlimited number of Portfolios and see your total in one currency
• Be alerted to new Warning Signs or Risks via email or mobile
• Track the Fair Value of your stocks
Have feedback on this article? Concerned about the content? Get in touch with us directly. Alternatively, email editorial-team@simplywallst.com
Simply Wall St analyst Stjepan Kalinic and Simply Wall St have no position in any of the companies mentioned. This article is general in nature. We provide commentary based on historical data and analyst forecasts only using an unbiased methodology and our articles are not intended to be financial advice. It does not constitute a recommendation to buy or sell any stock and does not take account of your objectives, or your financial situation. We aim to bring you long-term focused analysis driven by fundamental data. Note that our analysis may not factor in the latest price-sensitive company announcements or qualitative material.

Stjepan Kalinic
Stjepan is a writer and an analyst covering equity markets. As a former multi-asset analyst, he prefers to look beyond the surface and uncover ideas that might not be on retail investors' radar. You can find his research all over the internet, including Simply Wall St News, Yahoo Finance, Benzinga, Vincent, and Barron's.
About NYSE:ALB
Adequate balance sheet with moderate growth potential.
Similar Companies
Market Insights


Advertisement
Community Narratives
For the Emperor: Why Games Workshop Could Be a Star Investment
Fair Value UK£160.00|0.5% overvalued
RO
Community Contributor
Securitas will boost margins with AI and tech-driven services
Fair Value SEK 260.91|44.5% undervalued
UN
Community Contributor
A Leader in EV Charging with Growth Potential
Fair Value €27.00|18.7% undervalued
TI
Community Contributor