
Advertisement
- United States
- /
- Metals and Mining
- /
- NasdaqGS:FRD
Friedman Industries Full Year 2025 Earnings: EPS: US$0.87 (vs US$2.39 in FY 2024)

Friedman Industries (NASDAQ:FRD) Full Year 2025 Results
Key Financial Results
- Revenue: US$444.6m (down 14% from FY 2024).
- Net income: US$6.09m (down 65% from FY 2024).
- Profit margin: 1.4% (down from 3.3% in FY 2024). The decrease in margin was driven by lower revenue.
- EPS: US$0.87 (down from US$2.39 in FY 2024).
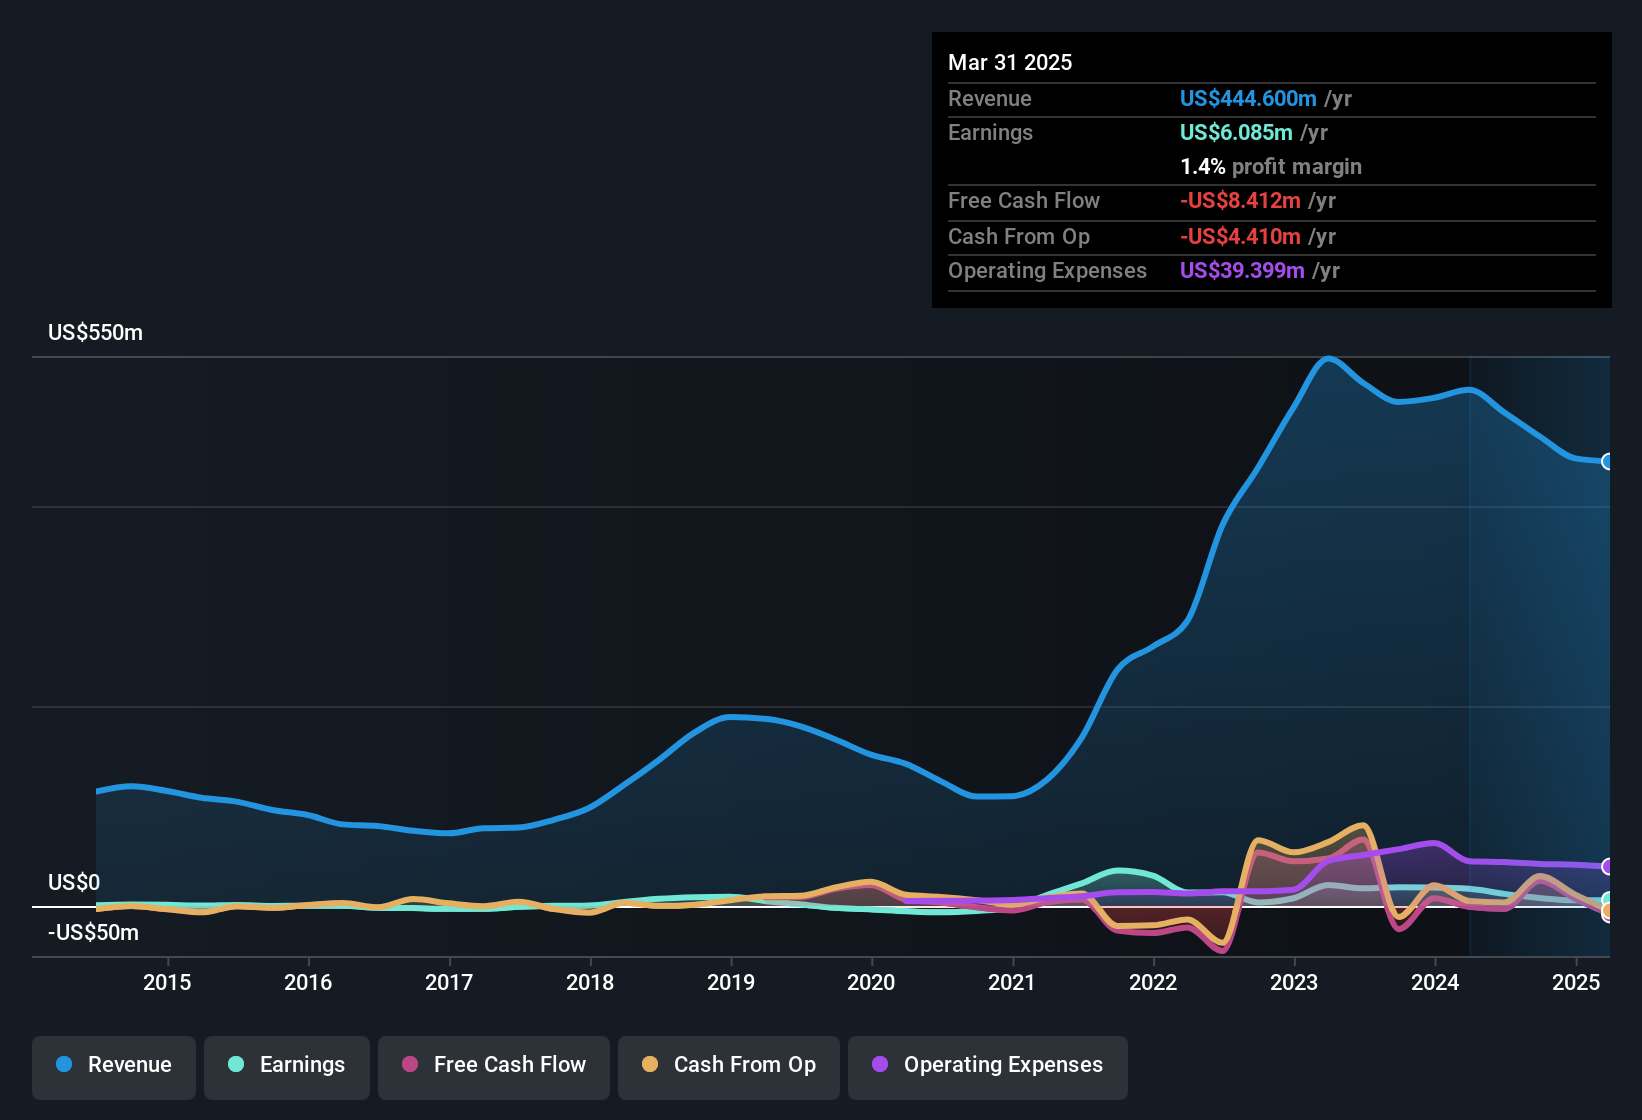
All figures shown in the chart above are for the trailing 12 month (TTM) period
Friedman Industries' share price is broadly unchanged from a week ago.
Risk Analysis
We don't want to rain on the parade too much, but we did also find 1 warning sign for Friedman Industries that you need to be mindful of.
New: AI Stock Screener & Alerts
Our new AI Stock Screener scans the market every day to uncover opportunities.
• Dividend Powerhouses (3%+ Yield)
• Undervalued Small Caps with Insider Buying
• High growth Tech and AI Companies
Or build your own from over 50 metrics.
Have feedback on this article? Concerned about the content? Get in touch with us directly. Alternatively, email editorial-team (at) simplywallst.com.
This article by Simply Wall St is general in nature. We provide commentary based on historical data and analyst forecasts only using an unbiased methodology and our articles are not intended to be financial advice. It does not constitute a recommendation to buy or sell any stock, and does not take account of your objectives, or your financial situation. We aim to bring you long-term focused analysis driven by fundamental data. Note that our analysis may not factor in the latest price-sensitive company announcements or qualitative material. Simply Wall St has no position in any stocks mentioned.
About NasdaqGS:FRD
Friedman Industries
Engages in the manufacture and processing of steel products in the United States.
Mediocre balance sheet and slightly overvalued.
Similar Companies
Market Insights

Advertisement
Community Narratives
The Future of Drug Testing? Fingerprint Tech Shows Serious Promise
Fair Value US$2.98|35.9% undervalued
JO
Community Contributor
Occidental Petroleum is set to achieve a 16% profit margin improvement
Fair Value US$55.05|15.6% undervalued
DZ
Community Contributor
Argan's Revenue Set to Soar with a 13.31% Growth in the Coming Decade
Fair Value US$284.68|23.4% undervalued
KE
Community Contributor
EU#1 - From German Startup to EU’s Biggest Company
Fair Value €248.62|2.5% overvalued
TO
Community Contributor