Advertisement
- United States
- /
- Insurance
- /
- NYSE:WRB
Can the 31.5% Jump in W. R. Berkley Shares Continue in 2025?

Simply Wall St
Reviewed by Bailey Pemberton
If you are trying to decide what to do with your W. R. Berkley shares right now, you are not alone. The stock may not be a household name, but savvy investors have noticed its recent got-your-attention growth, and even more so, the signals it is sending about its current value. Over just the past year, the share price has climbed an impressive 31.5%, and it is up a hefty 29.7% since the start of the year. The five-year result is even more eye-popping, with W. R. Berkley returning over 200% in that stretch. But with a modest uptick of 2.4% in the last week and a slight dip of -0.8% over the past month, some may wonder if the best is already behind it, or if there is room to run.
Part of what has powered W. R. Berkley recently is its steady hand during turbulent economic moments, alongside strategic moves within the insurance sector. The market has been reacting to both industry-wide shifts in risk management and the company’s ability to stick to its underwriting discipline. While the headlines might not mention a single seismic event, there is an accumulating sense among investors that this is a business quietly building momentum.
When it comes to valuation, the numbers do not lie. On a six-point scale covering different aspects of stock undervaluation, W. R. Berkley scores a 2, meaning it is undervalued in two out of six key checks. That is good, but is it good enough? Let us take a close look at the methods investors use to judge value. Also, stick around, because there is an even smarter way to weigh a stock’s true worth that most overlook, which we will cover at the end.
W. R. Berkley scores just 2/6 on our valuation checks. See what other red flags we found in the full valuation breakdown.
Approach 1: W. R. Berkley Excess Returns Analysis
The Excess Returns valuation model offers a direct way to judge how effectively a company generates profits above its cost of capital. For W. R. Berkley, this approach measures the return the company achieves on its investments compared to what shareholders require as a minimum.
Key metrics help paint a clear picture. W. R. Berkley’s current Book Value per share is $24.50, while the expected Stable Book Value over time is projected to be $29.84 per share. The company’s Stable EPS, based on future Return on Equity estimates from ten analysts, stands at $5.36 per share. W. R. Berkley’s Cost of Equity is estimated at $2.02 per share. The Excess Return is $3.34 per share, and the average Return on Equity is 17.95 percent. These numbers indicate the company is consistently generating profits that surpass its base cost of capital, which is a hallmark of value creation in the insurance sector.
According to the Excess Returns model, the intrinsic value for W. R. Berkley comes in significantly above its current market pricing, implying the stock is undervalued by about 37.3 percent at the time of analysis. This sizable gap suggests investors may still have an opportunity to gain from the market’s hesitation.
Result: UNDERVALUED
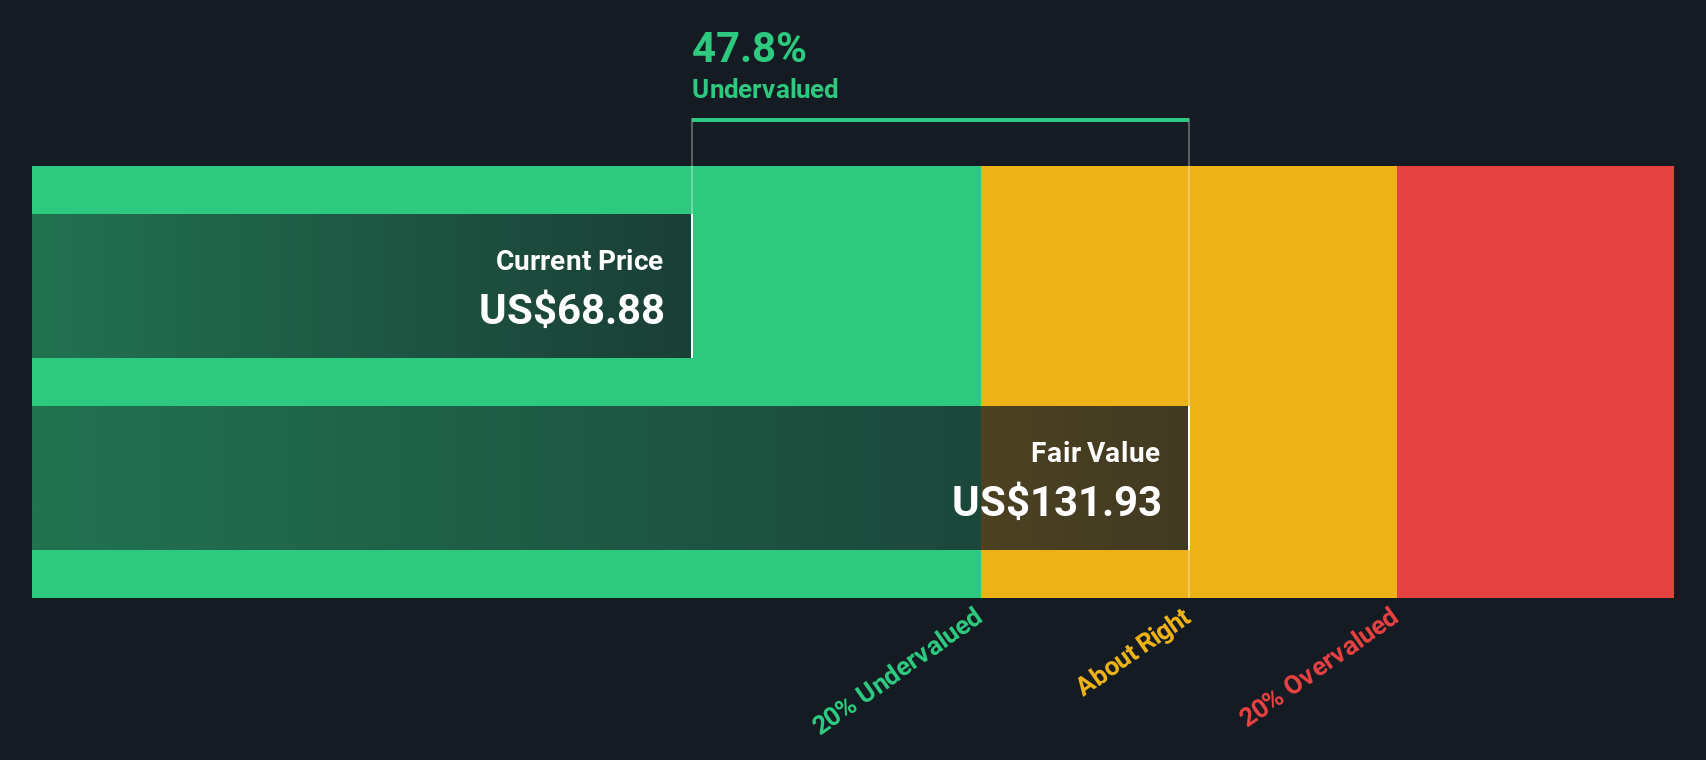
Our Excess Returns analysis suggests W. R. Berkley is undervalued by 37.3%. Track this in your watchlist or portfolio, or discover more undervalued stocks.
Approach 2: W. R. Berkley Price vs Earnings
The Price-to-Earnings (PE) ratio is a popular metric for valuing profitable companies like W. R. Berkley, because it reflects how much investors are willing to pay today for a dollar of earnings. For companies with stable profits, it is a direct way to compare current market price to underlying performance. However, the “right” PE ratio depends on more than just earnings. Growth expectations and risk both play important roles. Higher growth or lower risk can justify a higher PE, while lower growth or greater risk mean the market generally assigns a lower multiple.
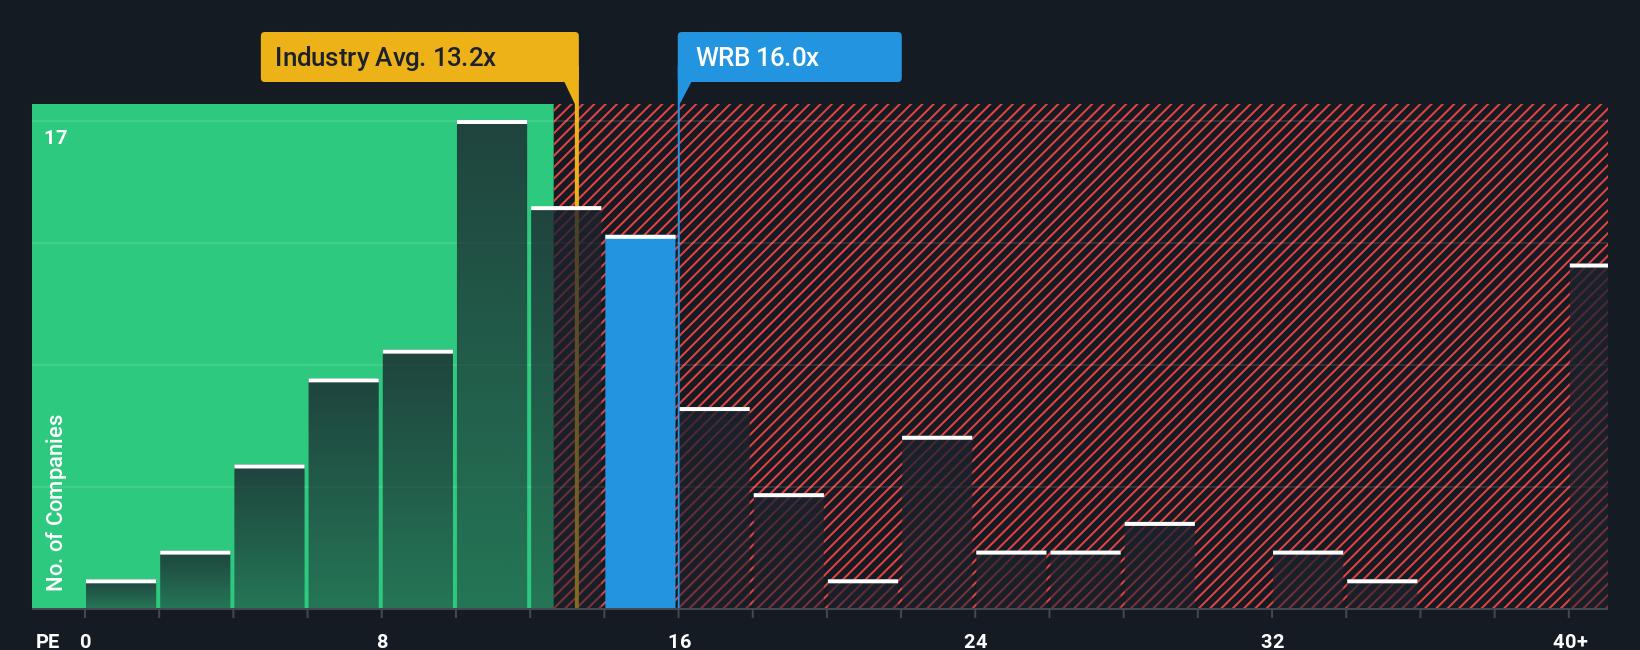
W. R. Berkley currently trades at a PE ratio of 15x. This is above the industry average of 13.5x and higher than the peer average of 12.7x, indicating the market sees something special in its earnings outlook. To dig deeper, Simply Wall St uses what it calls the “Fair Ratio,” which for W. R. Berkley is calculated at 12.6x. The Fair Ratio is a more tailored benchmark, factoring in earnings growth, profit margins, industry context, company size, and risk profile. Unlike simple peer or industry comparisons, this figure gives investors a nuanced, apples-to-apples sense of fair value.
Comparing the current PE of 15x to the Fair Ratio of 12.6x, shares are trading above the level warranted by the company’s fundamentals. This suggests that investors are paying a premium and the stock looks overvalued on this metric.
Result: OVERVALUED
PE ratios tell one story, but what if the real opportunity lies elsewhere? Discover companies where insiders are betting big on explosive growth.
Upgrade Your Decision Making: Choose your W. R. Berkley Narrative
Earlier we mentioned that there is an even better way to understand valuation, so let us introduce you to Narratives. A Narrative is simply your personal story or perspective on a company, where you can lay out what makes W. R. Berkley unique, map out your own expectations for its future revenue, earnings and margins, and connect those assumptions to the fair value you believe the stock deserves.
Unlike static metrics, Narratives let you link the company’s strategic story directly to a dynamic financial forecast and resulting fair value. This shows exactly how your views translate into an actionable investment thesis. Best of all, Narratives are simple to create and review within Simply Wall St’s Community page, used by millions of investors worldwide. You can easily compare your viewpoint to others or update your outlook over time.
By comparing the Fair Value from your Narrative to today’s Price, you get a clear signal on whether it could be time to buy, hold, or sell. Narratives automatically update as new information, such as news or earnings, is released, keeping your forecasts and fair values current with real-world events.
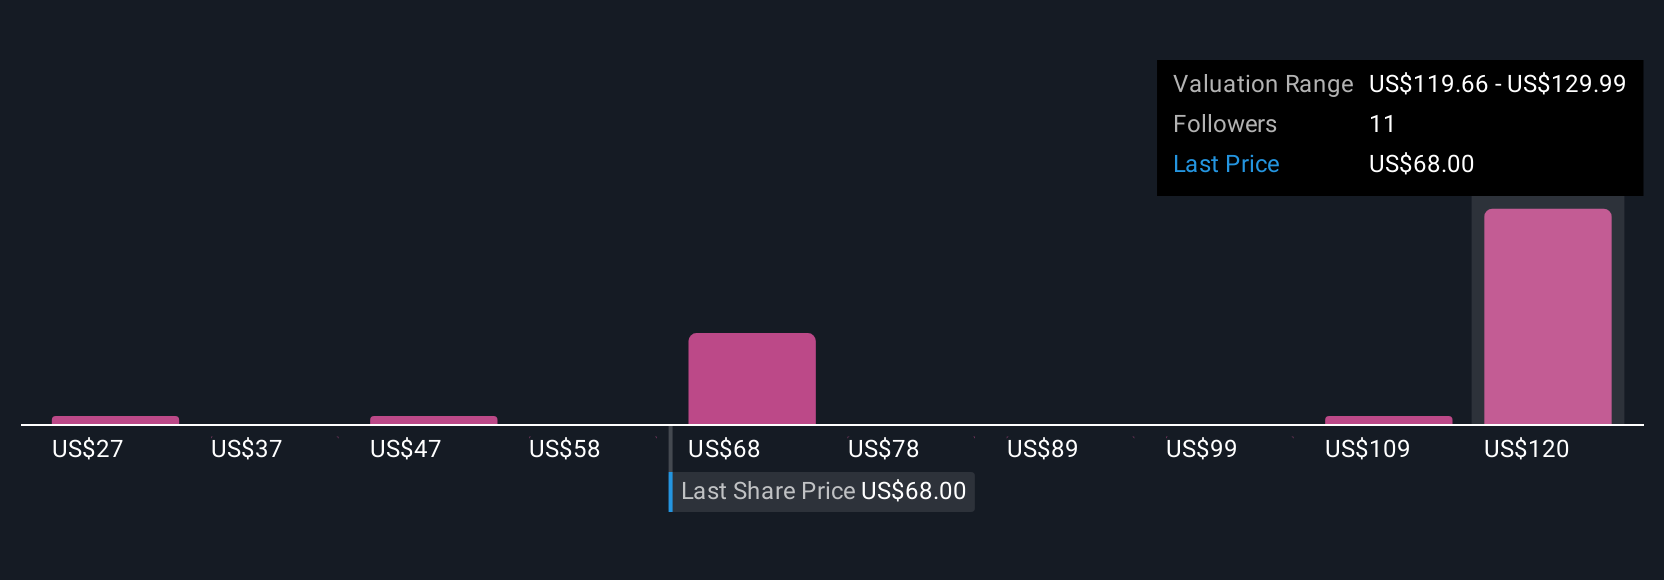
For example, with W. R. Berkley, some investors project a fair value of $86.00 based on optimistic growth and margin assumptions, while others see just $56.00 due to more cautious outlooks. This demonstrates how Narratives capture different investor stories and investment decisions in real-time.
Do you think there's more to the story for W. R. Berkley? Create your own Narrative to let the Community know!
This article by Simply Wall St is general in nature. We provide commentary based on historical data and analyst forecasts only using an unbiased methodology and our articles are not intended to be financial advice. It does not constitute a recommendation to buy or sell any stock, and does not take account of your objectives, or your financial situation. We aim to bring you long-term focused analysis driven by fundamental data. Note that our analysis may not factor in the latest price-sensitive company announcements or qualitative material. Simply Wall St has no position in any stocks mentioned.
Valuation is complex, but we're here to simplify it.
Discover if W. R. Berkley might be undervalued or overvalued with our detailed analysis, featuring fair value estimates, potential risks, dividends, insider trades, and its financial condition.
Access Free AnalysisHave feedback on this article? Concerned about the content? Get in touch with us directly. Alternatively, email editorial-team@simplywallst.com
About NYSE:WRB
W. R. Berkley
An insurance holding company, operates as a commercial line writer worldwide.
Outstanding track record with excellent balance sheet and pays a dividend.
Similar Companies
Market Insights

Advertisement
Community Narratives
The company that turned a verb into a global necessity and basically runs the modern internet, digital ads, smartphones, maps, and AI.
Fair Value US$300.00|10.2% undervalued
OS
Community Contributor
Flowers Foods Pays A Fair Price For Health
Fair Value US$16.12|20.3% undervalued
NV
Community Contributor
TMX Group will thrive with 33.3% profit margin and enduring market moat
Fair Value CA$49.90|0.1% undervalued
LI
Community Contributor