Advertisement
- United States
- /
- Insurance
- /
- NYSE:RGA
Are Shares of RGA Still Attractive After 13% Decline Amid Industry Volatility in 2025?

Simply Wall St
Reviewed by Bailey Pemberton
- Ever wondered if Reinsurance Group of America is trading at a bargain or if the growth ship has sailed? Let’s dive straight in and see whether there’s still value left on the table.
- The stock has recently pulled back, sliding 1.2% this week and 13.0% year-to-date, but zooming out reveals it’s up a robust 86.7% over the last five years.
- Much of this volatility comes in the wake of industry news highlighting shifting reinsurance trends and evolving regulatory environments, which have investors recalibrating expectations. Headlines around global catastrophe modeling and merger activity have also contributed to short-term sentiment swings.
- When it comes to valuation, Reinsurance Group of America scores 4 out of 6 on our valuation checks, suggesting undeniably attractive pockets of value. Let’s go further than the numbers and explore powerful new ways to assess what RGA is really worth.
Approach 1: Reinsurance Group of America Excess Returns Analysis
The Excess Returns valuation model helps assess a firm's value by focusing on its return on invested capital relative to its cost of equity. Instead of relying solely on cash flow estimates, this approach examines how much profit Reinsurance Group of America generates from its equity base beyond what it would cost to fund that equity. This provides a powerful lens for financial companies, highlighting the real economic value created for shareholders.
For Reinsurance Group of America, the figures are compelling. The company boasts a Book Value of $197.51 per share and a Stable EPS of $29.82 per share, based on consensus from six analysts. Its Cost of Equity is $14.88 per share, yet it delivers an Excess Return of $14.94 per share. Furthermore, its Average Return on Equity stands at 13.58 percent, comfortably exceeding the required cost. Stable Book Value is projected at $219.54 per share, as estimated by seven analysts.
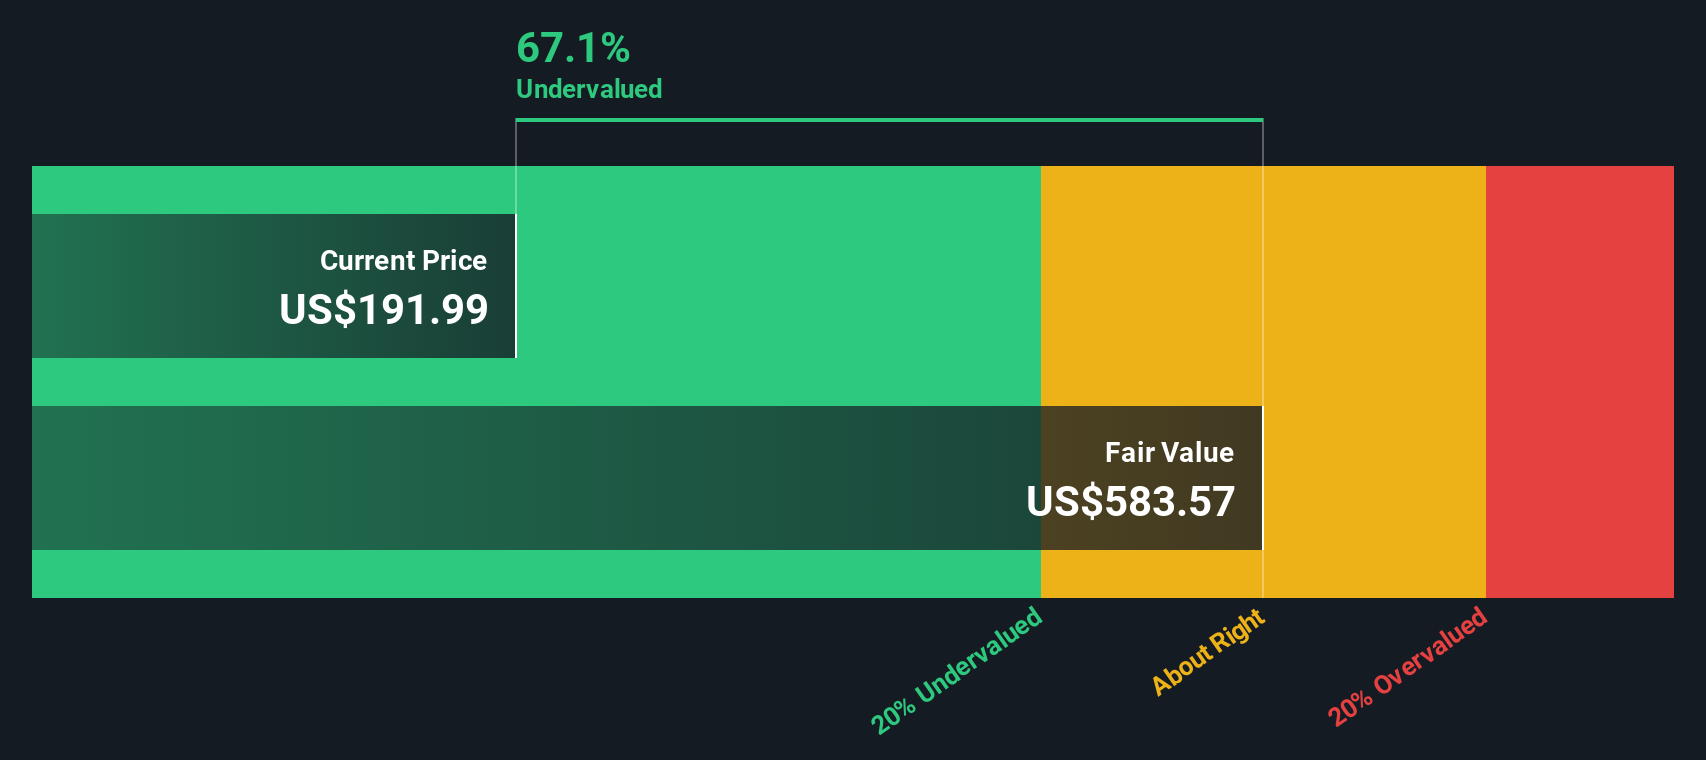
Based on these robust metrics, the Excess Returns model estimates the intrinsic value at $623.81 per share. With the current market price reflecting a 70.0 percent discount to this valuation, the model signals that RGA stock is significantly undervalued at present levels.
Result: UNDERVALUED
Our Excess Returns analysis suggests Reinsurance Group of America is undervalued by 70.0%. Track this in your watchlist or portfolio, or discover 835 more undervalued stocks based on cash flows.
Approach 2: Reinsurance Group of America Price vs Earnings
The Price-to-Earnings (PE) ratio is widely favored for valuing profitable companies like Reinsurance Group of America, as it directly ties a company's share price to its reported earnings. For investors, the PE ratio provides a simple metric to judge how much the market is willing to pay for each dollar of earnings. This makes it especially useful when the company has a stable or growing profit base.
It is important to note that the "normal" or "fair" PE ratio for a stock is not set in stone. Higher expected growth rates or lower perceived risks can justify a higher PE. On the other hand, slower growth or greater risks typically mean investors will pay less for each dollar of earnings.
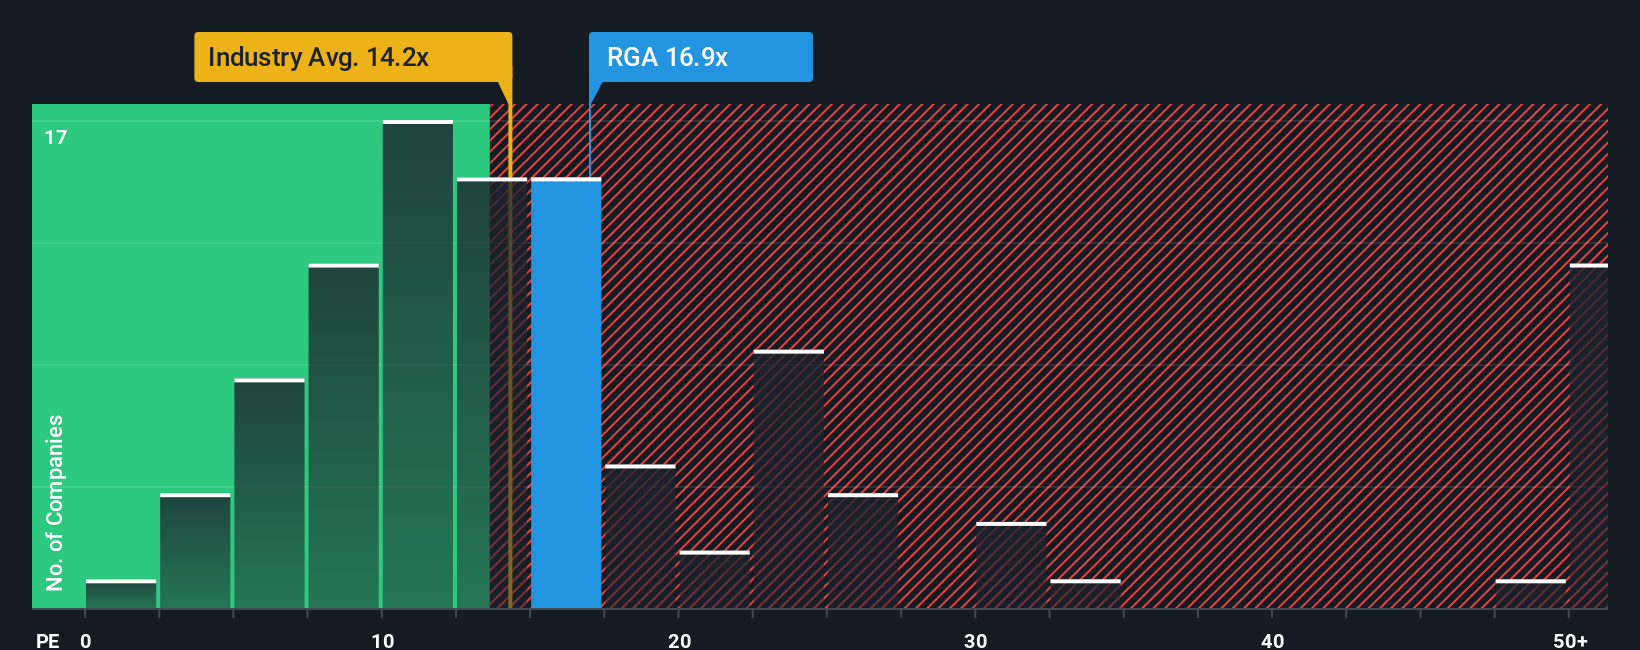
As of now, Reinsurance Group of America trades at a PE of 14.2x. This compares favorably to the Insurance industry average of 13.6x and sits just above its peer average of 14.1x. To refine this further, Simply Wall St's proprietary "Fair Ratio" suggests that 21.4x would be a reasonable multiple because it adjusts for RGA’s specific growth profile, margins, market capitalization, and risk factors. This approach is more comprehensive than generic industry or peer averages, since it takes into account the nuances that truly impact how much a company should be worth.
With RGA's current PE significantly below the Fair Ratio, the shares appear to be undervalued based on this method.
Result: UNDERVALUED
PE ratios tell one story, but what if the real opportunity lies elsewhere? Discover 1406 companies where insiders are betting big on explosive growth.
Upgrade Your Decision Making: Choose your Reinsurance Group of America Narrative
As mentioned earlier, there is an even more insightful way to look at valuation: Narratives. A Narrative is simply the story behind your investment, a perspective that combines not just the raw numbers, but your assumptions about Reinsurance Group of America's future revenue, earnings, margins, and fair value.
By linking the company’s story to a financial forecast and then calculating fair value, Narratives let you capture your thinking in a powerful and personal way. This approach is accessible to every investor using Simply Wall St’s Community page, where millions of users can compare and refine their perspectives in real time.
With Narratives, you quickly see if your view of fair value is above or below the current share price, helping you time your buy or sell decisions more confidently. Because Narratives are dynamically updated when new information such as financial results or industry news arrives, you are always in sync with the latest data and insights.
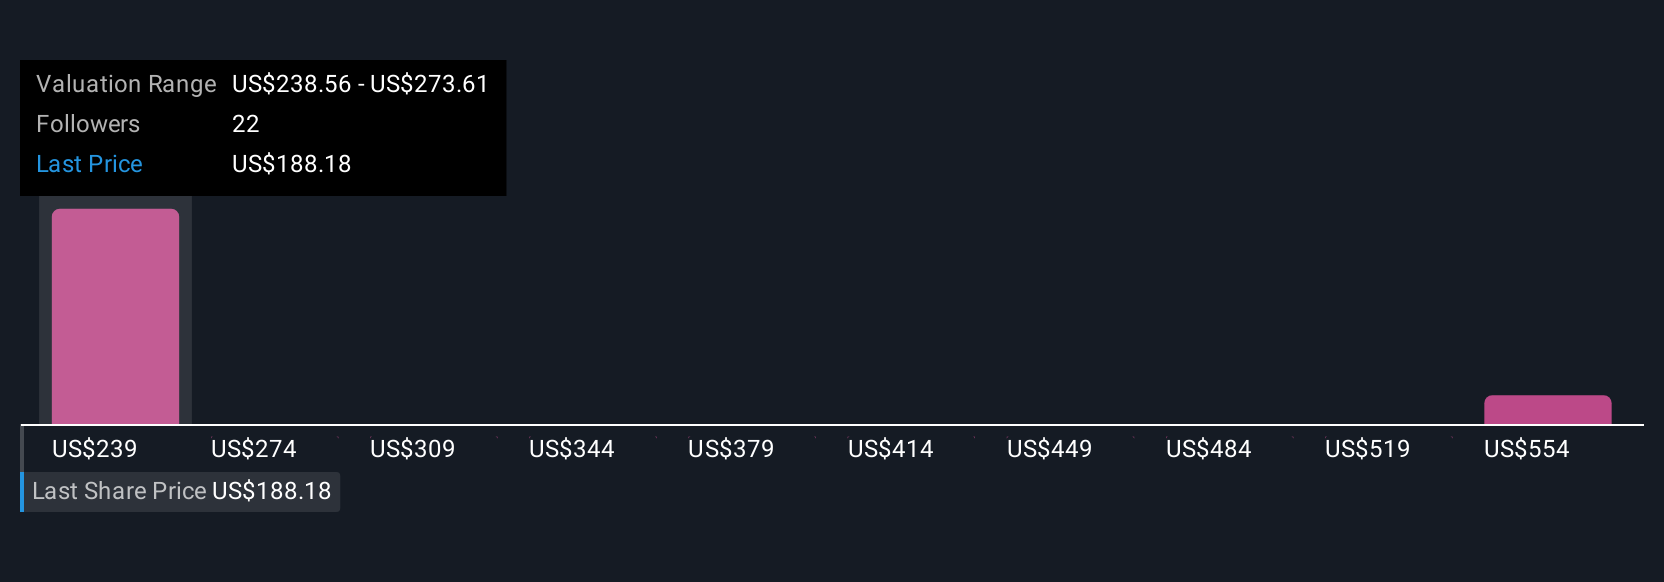
For example, looking at Reinsurance Group of America, some investors project a fair value as high as $275.0 based on bullish assumptions of global market expansion and margin gains, while the most cautious see just $195.0, emphasizing earnings volatility and regulatory hurdles. This shows how Narratives clarify the reasons behind every price target.
Do you think there's more to the story for Reinsurance Group of America? Head over to our Community to see what others are saying!
This article by Simply Wall St is general in nature. We provide commentary based on historical data and analyst forecasts only using an unbiased methodology and our articles are not intended to be financial advice. It does not constitute a recommendation to buy or sell any stock, and does not take account of your objectives, or your financial situation. We aim to bring you long-term focused analysis driven by fundamental data. Note that our analysis may not factor in the latest price-sensitive company announcements or qualitative material. Simply Wall St has no position in any stocks mentioned.
New: AI Stock Screener & Alerts
Our new AI Stock Screener scans the market every day to uncover opportunities.
• Dividend Powerhouses (3%+ Yield)
• Undervalued Small Caps with Insider Buying
• High growth Tech and AI Companies
Or build your own from over 50 metrics.
Have feedback on this article? Concerned about the content? Get in touch with us directly. Alternatively, email editorial-team@simplywallst.com
About NYSE:RGA
Reinsurance Group of America
Provides reinsurance and financial solutions.
Solid track record established dividend payer.
Similar Companies
Market Insights

Advertisement
Community Narratives
The company that turned a verb into a global necessity and basically runs the modern internet, digital ads, smartphones, maps, and AI.
Fair Value US$300.00|5.2% undervalued
OS
Community Contributor
Flowers Foods Pays A Fair Price For Health
Fair Value US$16.12|24.9% undervalued
NV
Community Contributor
TMX Group will thrive with 33.3% profit margin and enduring market moat
Fair Value CA$49.90|3.3% overvalued
LI
Community Contributor
The "Molecular Pencil": Why Beam's Technology is Built to Win
Fair Value US$65.01|64.5% undervalued
DA
Community Contributor