Advertisement
- United States
- /
- Insurance
- /
- NYSE:PGR
Evaluating Progressive After Recent Technology and Pricing Moves Amid 3.6% Weekly Gain

Simply Wall St
Reviewed by Bailey Pemberton
- Ever wondered if Progressive is a hidden gem or priced about right? You are not alone, with many investors considering its future value.
- After a bumpy start to the year, Progressive's shares have recently gained 3.6% in the past week, trimming what has otherwise been a slightly negative run. The stock is down 6.4% year to date and 10.2% over the last year. Looking at a longer time frame, the company’s outlook has been strong, with shares up 80.7% over the past three years and 166.8% over five years.
- Recent news cycles have focused on Progressive's strategic moves in the insurance landscape, including new technology deployments and competitive pricing adjustments. These developments have sparked discussions about the company's potential to adapt quickly and continue outperforming, or whether new risks could be on the horizon.
- When it comes to valuation, Progressive currently scores 3 out of 6 on our undervaluation checks. We will break down what each of these valuation approaches reveal, and toward the end, we will share an even better way to cut through the noise and understand where fair value really lies.
Find out why Progressive's -10.2% return over the last year is lagging behind its peers.
Approach 1: Progressive Excess Returns Analysis
The Excess Returns model evaluates a company's ability to generate returns on invested capital above its cost of equity. Simply put, it measures how much extra profit Progressive delivers on every dollar invested, after accounting for what it costs the company to raise that money from shareholders.
For Progressive, the average return on equity stands at an impressive 27.54%, far exceeding its $5.06 per share cost of equity. The model estimates a stable, long-term book value of $72.69 per share (as projected by 12 analysts) and a stable earnings per share of $20.02 (based on 13 analyst forecasts). The resulting excess return, which is the value generated above the cost of equity, is $14.96 per share.
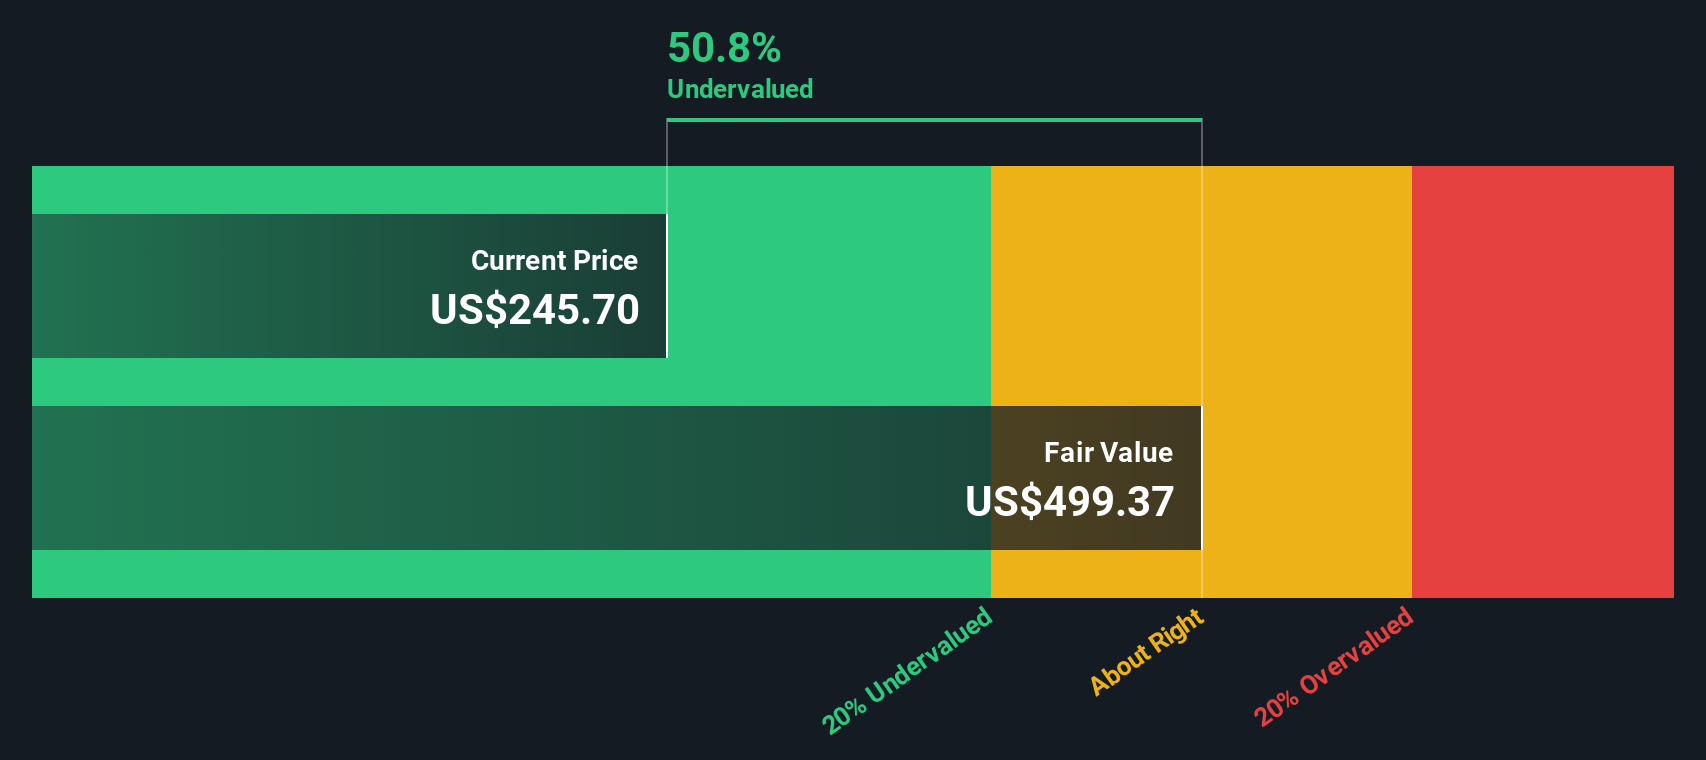
Using these inputs, the Excess Returns model calculates an intrinsic value of $477.55 per share. Given the current market price, this analysis suggests Progressive shares are trading at a 52.8% discount to intrinsic value, indicating a substantial margin of undervaluation.
Result: UNDERVALUED
Our Excess Returns analysis suggests Progressive is undervalued by 52.8%. Track this in your watchlist or portfolio, or discover 878 more undervalued stocks based on cash flows.
Approach 2: Progressive Price vs Earnings
For profitable companies like Progressive, the price-to-earnings (PE) ratio is widely considered a go-to valuation tool. It gives investors a direct sense of how much they are paying for every dollar of earnings, which works best for businesses with stable and sizable profits.
The “right” PE ratio can vary. Higher growth expectations or lower perceived risk can justify paying a higher multiple, while more risks or slower growth might push it down. That is why it is important not to look at a PE in isolation, but rather to compare it against industry standards and peers.
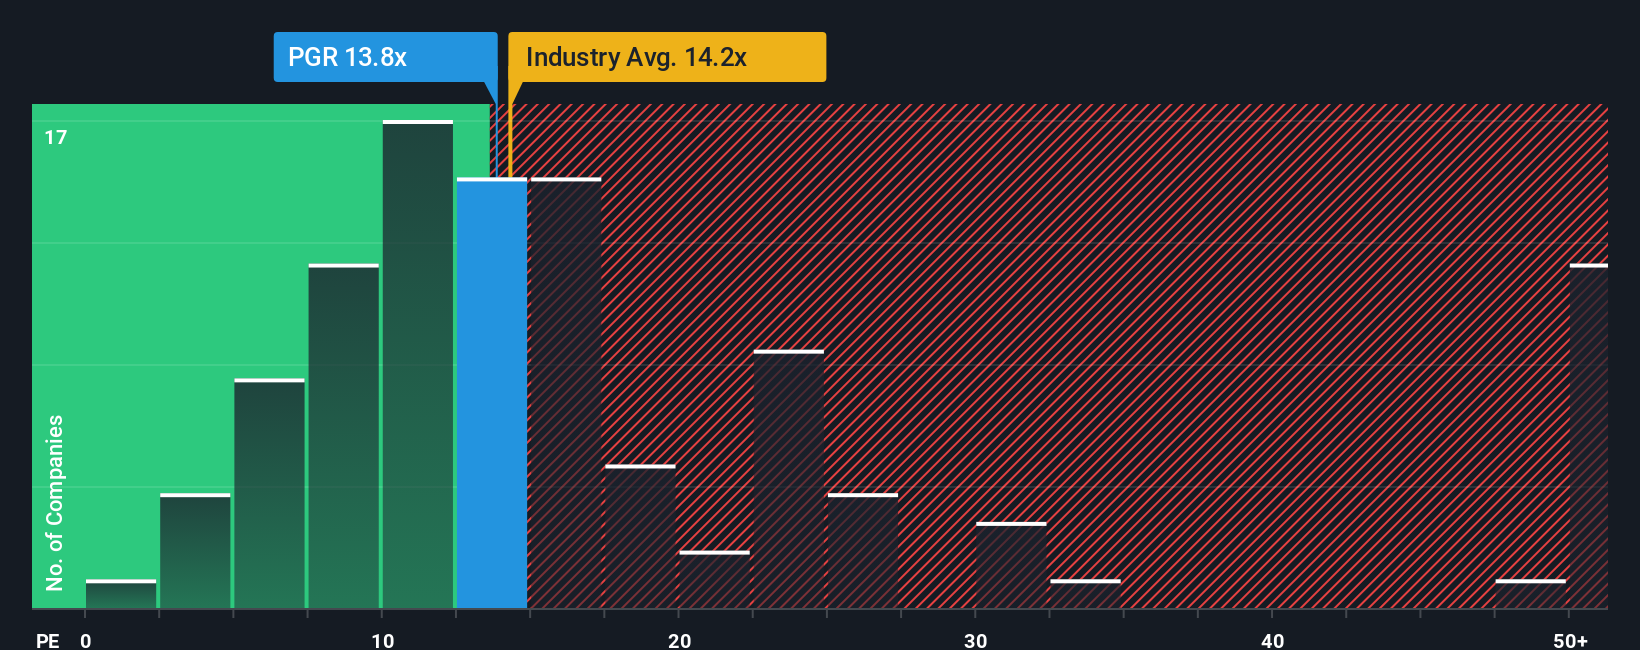
Progressive trades at a PE ratio of 12.33x, which is below the insurance industry average of 13.36x, and also undercuts the average of its closest peers at 9.51x. However, it is important to look beyond headline comparisons. Simply Wall St’s “Fair Ratio” for Progressive, which weighs in at 10.77x, is calculated by factoring in earnings growth, risk profile, market cap, and profitability. This custom approach is a step beyond just benchmarking, as it accounts for nuances unique to Progressive that industry-wide figures might miss.
Compared to the Fair Ratio of 10.77x, Progressive’s actual PE ratio of 12.33x is slightly higher. This suggests the shares may be priced a little above fair value when all factors are considered.
Result: OVERVALUED
PE ratios tell one story, but what if the real opportunity lies elsewhere? Discover 1408 companies where insiders are betting big on explosive growth.
Upgrade Your Decision Making: Choose your Progressive Narrative
Earlier we mentioned that there is an even better way to understand valuation, so let us introduce you to Narratives. A Narrative is your personal investing story. It is how you see the company’s future and what you believe Progressive is worth, based on your assumptions about future revenue, earnings, and profit margins. Instead of just crunching numbers or following analyst targets, Narratives connect these beliefs to a financial forecast, then translate that into a Fair Value for the stock.
This approach is easy to use and is available right on Simply Wall St’s platform, under the Community page, where millions of investors shape and share Narratives daily. Narratives make it simple to see when your view suggests the stock is undervalued or overvalued, as you can instantly compare your Fair Value to the current market price. Plus, Narratives update in real time when new earnings, news, or company events come in, keeping you dynamically aligned with the latest information.
For Progressive, for example, some investors’ Narratives reflect optimism, projecting a Fair Value as high as $344 per share by expecting robust premium growth and margin resilience, while more cautious perspectives forecast just $189, echoing concerns over competitive and regulatory risks. With Narratives, you can choose or create your own path, and always make your investment decisions based on the story you believe in most.
Do you think there's more to the story for Progressive? Head over to our Community to see what others are saying!
This article by Simply Wall St is general in nature. We provide commentary based on historical data and analyst forecasts only using an unbiased methodology and our articles are not intended to be financial advice. It does not constitute a recommendation to buy or sell any stock, and does not take account of your objectives, or your financial situation. We aim to bring you long-term focused analysis driven by fundamental data. Note that our analysis may not factor in the latest price-sensitive company announcements or qualitative material. Simply Wall St has no position in any stocks mentioned.
New: Manage All Your Stock Portfolios in One Place
We've created the ultimate portfolio companion for stock investors, and it's free.
• Connect an unlimited number of Portfolios and see your total in one currency
• Be alerted to new Warning Signs or Risks via email or mobile
• Track the Fair Value of your stocks
Have feedback on this article? Concerned about the content? Get in touch with us directly. Alternatively, email editorial-team@simplywallst.com
About NYSE:PGR
Outstanding track record with excellent balance sheet and pays a dividend.
Similar Companies
Market Insights

Advertisement
Community Narratives
MINISO's fair value is projected at 26.69 with an anticipated PE ratio shift of 20x
Fair Value US$24.03|11.0% undervalued
BE
Community Contributor
Procter & Gamble: A Dividend Giant Facing Slowing Growth
Fair Value US$119.81|23.3% overvalued
AN
Community Contributor
Eli Lilly's Future Growth Driven by Tirzepatide and Favorable Market Conditions
Fair Value US$1.19k|13.8% undervalued
EA
Community Contributor