- United States
- /
- Insurance
- /
- NYSE:HIG
Is The Hartford Financial Services Group, Inc.'s (NYSE:HIG) Stock's Recent Performance Being Led By Its Attractive Financial Prospects?


Hartford Financial Services Group's (NYSE:HIG) stock is up by a considerable 18% over the past three months. Since the market usually pay for a company’s long-term fundamentals, we decided to study the company’s key performance indicators to see if they could be influencing the market. Particularly, we will be paying attention to Hartford Financial Services Group's ROE today.
Return on equity or ROE is an important factor to be considered by a shareholder because it tells them how effectively their capital is being reinvested. Simply put, it is used to assess the profitability of a company in relation to its equity capital.
Check out our latest analysis for Hartford Financial Services Group
How Do You Calculate Return On Equity?
The formula for ROE is:
Return on Equity = Net Profit (from continuing operations) ÷ Shareholders' Equity
So, based on the above formula, the ROE for Hartford Financial Services Group is:
19% = US$2.9b ÷ US$16b (Based on the trailing twelve months to June 2024).
The 'return' is the yearly profit. Another way to think of that is that for every $1 worth of equity, the company was able to earn $0.19 in profit.
What Is The Relationship Between ROE And Earnings Growth?
Thus far, we have learned that ROE measures how efficiently a company is generating its profits. We now need to evaluate how much profit the company reinvests or "retains" for future growth which then gives us an idea about the growth potential of the company. Assuming everything else remains unchanged, the higher the ROE and profit retention, the higher the growth rate of a company compared to companies that don't necessarily bear these characteristics.
Hartford Financial Services Group's Earnings Growth And 19% ROE
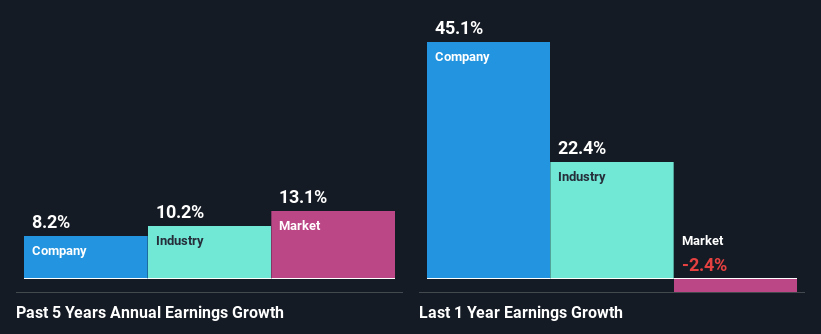
At first glance, Hartford Financial Services Group seems to have a decent ROE. On comparing with the average industry ROE of 13% the company's ROE looks pretty remarkable. This probably laid the ground for Hartford Financial Services Group's moderate 8.2% net income growth seen over the past five years.
Next, on comparing Hartford Financial Services Group's net income growth with the industry, we found that the company's reported growth is similar to the industry average growth rate of 10% over the last few years.
Earnings growth is a huge factor in stock valuation. It’s important for an investor to know whether the market has priced in the company's expected earnings growth (or decline). By doing so, they will have an idea if the stock is headed into clear blue waters or if swampy waters await. One good indicator of expected earnings growth is the P/E ratio which determines the price the market is willing to pay for a stock based on its earnings prospects. So, you may want to check if Hartford Financial Services Group is trading on a high P/E or a low P/E, relative to its industry.
Is Hartford Financial Services Group Making Efficient Use Of Its Profits?
Hartford Financial Services Group's three-year median payout ratio to shareholders is 23% (implying that it retains 77% of its income), which is on the lower side, so it seems like the management is reinvesting profits heavily to grow its business.
Moreover, Hartford Financial Services Group is determined to keep sharing its profits with shareholders which we infer from its long history of paying a dividend for at least ten years. Our latest analyst data shows that the future payout ratio of the company is expected to drop to 17% over the next three years. Despite the lower expected payout ratio, the company's ROE is not expected to change by much.
Conclusion
Overall, we are quite pleased with Hartford Financial Services Group's performance. Particularly, we like that the company is reinvesting heavily into its business, and at a high rate of return. Unsurprisingly, this has led to an impressive earnings growth. We also studied the latest analyst forecasts and found that the company's earnings growth is expected be similar to its current growth rate. To know more about the latest analysts predictions for the company, check out this visualization of analyst forecasts for the company.
Valuation is complex, but we're here to simplify it.
Discover if Hartford Financial Services Group might be undervalued or overvalued with our detailed analysis, featuring fair value estimates, potential risks, dividends, insider trades, and its financial condition.
Access Free AnalysisHave feedback on this article? Concerned about the content? Get in touch with us directly. Alternatively, email editorial-team (at) simplywallst.com.
This article by Simply Wall St is general in nature. We provide commentary based on historical data and analyst forecasts only using an unbiased methodology and our articles are not intended to be financial advice. It does not constitute a recommendation to buy or sell any stock, and does not take account of your objectives, or your financial situation. We aim to bring you long-term focused analysis driven by fundamental data. Note that our analysis may not factor in the latest price-sensitive company announcements or qualitative material. Simply Wall St has no position in any stocks mentioned.
About NYSE:HIG
Hartford Financial Services Group
Provides insurance and financial services to individual and business customers in the United States, the United Kingdom, and internationally.
Excellent balance sheet established dividend payer.

