- United States
- /
- Insurance
- /
- NYSE:CNO
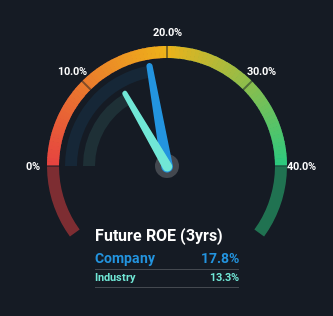
Can CNO Financial Group, Inc.'s (NYSE:CNO) ROE Continue To Surpass The Industry Average?


One of the best investments we can make is in our own knowledge and skill set. With that in mind, this article will work through how we can use Return On Equity (ROE) to better understand a business. To keep the lesson grounded in practicality, we'll use ROE to better understand CNO Financial Group, Inc. (NYSE:CNO).
Return on Equity or ROE is a test of how effectively a company is growing its value and managing investors’ money. In other words, it is a profitability ratio which measures the rate of return on the capital provided by the company's shareholders.
View our latest analysis for CNO Financial Group
How To Calculate Return On Equity?
The formula for ROE is:
Return on Equity = Net Profit (from continuing operations) ÷ Shareholders' Equity
So, based on the above formula, the ROE for CNO Financial Group is:
18% = US$432m ÷ US$2.4b (Based on the trailing twelve months to June 2024).
The 'return' is the yearly profit. That means that for every $1 worth of shareholders' equity, the company generated $0.18 in profit.
Does CNO Financial Group Have A Good Return On Equity?
One simple way to determine if a company has a good return on equity is to compare it to the average for its industry. The limitation of this approach is that some companies are quite different from others, even within the same industry classification. Pleasingly, CNO Financial Group has a superior ROE than the average (13%) in the Insurance industry.
That's what we like to see. With that said, a high ROE doesn't always indicate high profitability. Especially when a firm uses high levels of debt to finance its debt which may boost its ROE but the high leverage puts the company at risk. You can see the 2 risks we have identified for CNO Financial Group by visiting our risks dashboard for free on our platform here.
How Does Debt Impact ROE?
Companies usually need to invest money to grow their profits. The cash for investment can come from prior year profits (retained earnings), issuing new shares, or borrowing. In the first and second cases, the ROE will reflect this use of cash for investment in the business. In the latter case, the debt used for growth will improve returns, but won't affect the total equity. That will make the ROE look better than if no debt was used.
Combining CNO Financial Group's Debt And Its 18% Return On Equity
CNO Financial Group does use a high amount of debt to increase returns. It has a debt to equity ratio of 1.86. While its ROE is pretty respectable, the amount of debt the company is carrying currently is not ideal. Debt does bring extra risk, so it's only really worthwhile when a company generates some decent returns from it.
Conclusion
Return on equity is one way we can compare its business quality of different companies. In our books, the highest quality companies have high return on equity, despite low debt. If two companies have the same ROE, then I would generally prefer the one with less debt.
But ROE is just one piece of a bigger puzzle, since high quality businesses often trade on high multiples of earnings. The rate at which profits are likely to grow, relative to the expectations of profit growth reflected in the current price, must be considered, too. So you might want to take a peek at this data-rich interactive graph of forecasts for the company.
Of course CNO Financial Group may not be the best stock to buy. So you may wish to see this free collection of other companies that have high ROE and low debt.
New: AI Stock Screener & Alerts
Our new AI Stock Screener scans the market every day to uncover opportunities.
• Dividend Powerhouses (3%+ Yield)
• Undervalued Small Caps with Insider Buying
• High growth Tech and AI Companies
Or build your own from over 50 metrics.
Have feedback on this article? Concerned about the content? Get in touch with us directly. Alternatively, email editorial-team (at) simplywallst.com.
This article by Simply Wall St is general in nature. We provide commentary based on historical data and analyst forecasts only using an unbiased methodology and our articles are not intended to be financial advice. It does not constitute a recommendation to buy or sell any stock, and does not take account of your objectives, or your financial situation. We aim to bring you long-term focused analysis driven by fundamental data. Note that our analysis may not factor in the latest price-sensitive company announcements or qualitative material. Simply Wall St has no position in any stocks mentioned.
About NYSE:CNO
CNO Financial Group
Through its subsidiaries, develops, markets, and administers health insurance, annuity, individual life insurance, insurance products, and financial services for senior and middle-income markets in the United States.
Solid track record established dividend payer.

